Process Description
Phenotype Summary
The Phenotype Summary process provides a quick and easy method for summarizing and displaying information about both categorical and quantitative phenotypes for a population. It computes frequencies and generates histograms for categorical phenotypes and calculates summary statistics and plots distributions for quantitative phenotypes.
What do I need?
One Input Data Set containing all of the phenotypic data is required.
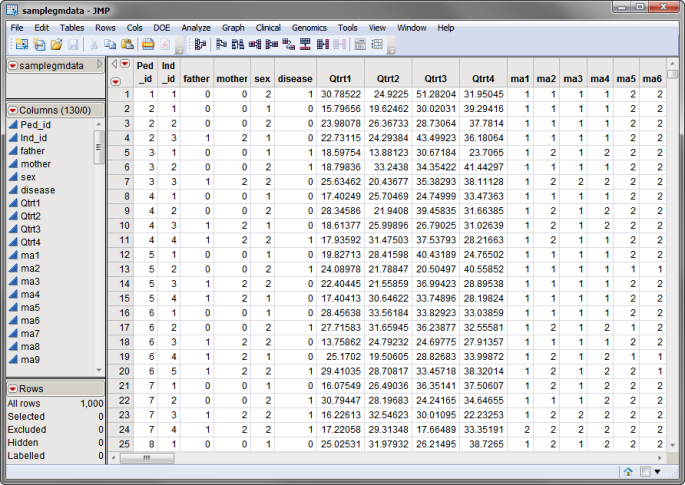
The samplegmdata.sas7bdat data set used in the following example was computer generated and consists of 1000 rows of individuals with 130 columns corresponding to data on these individuals. There are 2 categorical phenotypic variables (sex and disease status) and 4 quantitative phenotypic variables (Qtrt1, Qtrt2, Qtrt3, and Qtrt4). Genotypes for 60 different markers are presented in the two-column allelic format (ma1 — ma120). This data set is partially shown below.

Note that this is a wide data set; phenotypes and markers are listed in columns, whereas individuals are listed in rows.
The samplegmdata.sas7bdat data set is included in the Sample Data directory.
For detailed information about the files and data sets used or created by JMP Genomics software, see Files and Data Sets.
Output/Results
The output generated by this process is summarized in a Tabbed report. Refer to the Phenotype Summary output documentation for detailed descriptions and guides to interpreting your results.