Process Description
2D Plot
The Spectral 2D Plot process creates plots of two-dimensional spectra.
Three plots are currently supported: a Cell Plot (heat map) of the data, an Overlay Plot (line plot) of the data, and an Overlay Plot of the means of two groups with confidence bands.
What do I need?
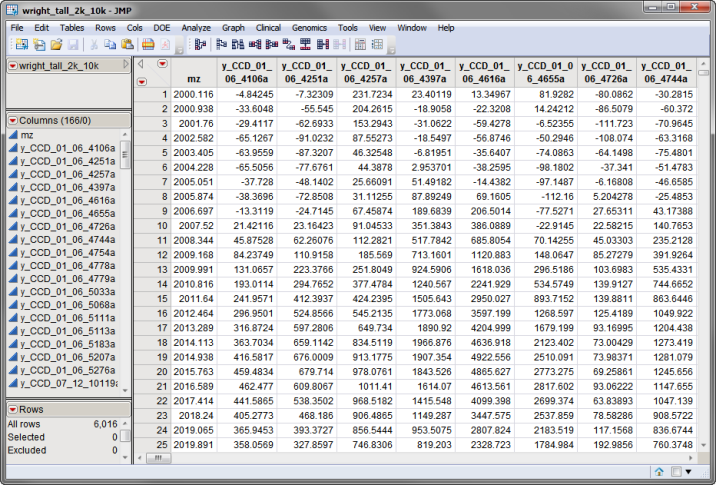
One data set is required to run the Spectral 2D Peak Find process. This data set must be in tall format, with one variable (column) for each spectrum and another variable for the value of the m/z or time-of-flight index. The name of the input SAS data set must be lowercase.
The wright_tall_2k_10k.sas7bdat data set, shown below, lists 165 individual spectra. The mz column lists the m/z values for each of the points in the spectra.

The wright_tall_2k_10k.sas7bdat data set is located in the Sample Data\Proteomics directory.
For detailed information about the files and data sets used or created by JMP Genomics software, see Files and Data Sets.
Output/Results
The output generated by this process is summarized in a Tabbed report. Refer to the 2D Plot output documentation for detailed descriptions and guides to interpreting your results.