Process Description
Genomic BLUP
The Genomic BLUP process computes Best Linear Unbiased Predictions (BLUPs) of the response variables based on a mixed model that includes an additive variance component, and optionally a dominance variance. Additive and dominance genomic relationship matrices are computed based on the scores of molecular markers, and these matrices are then entered in the mixed model to be used in the estimation of their respective variance components, i.e., additive and dominance variances. Computations are performed using either SAS/STAT PROC MIXED or HPMIXED. Summary statistics and visual display of the results are provided and can help breeders select best performing samples (lines or individuals) to follow-up with the Progeny Simulation process to produce offspring for the next breeding cycle.
What do I need?
One wide Input Data Set containing response variables and marker variables holding scores of molecular markers is required. The sample data set used in the following example, the samplegmdata_numgeno data set, is partially shown below.
Note: Genotypes must be coded as 0, 1, 2, or dot (.) (for missing value) before this data set can be input into this process.

The original samplegmdata data set described in Data Sets Used in JMP Genomics Processes was computer generated and consists of 1000 rows of individuals with 130 columns corresponding to data on these individuals. Marker data is presented in the two-column allelic format. This data set was recoded using the Recode Genotypes process to generate samplegmdata_numgeno data set. The recoded data set consists of 611 rows with 70 columns. Marker data is presented as numeric variables in the one-column genotypic format.
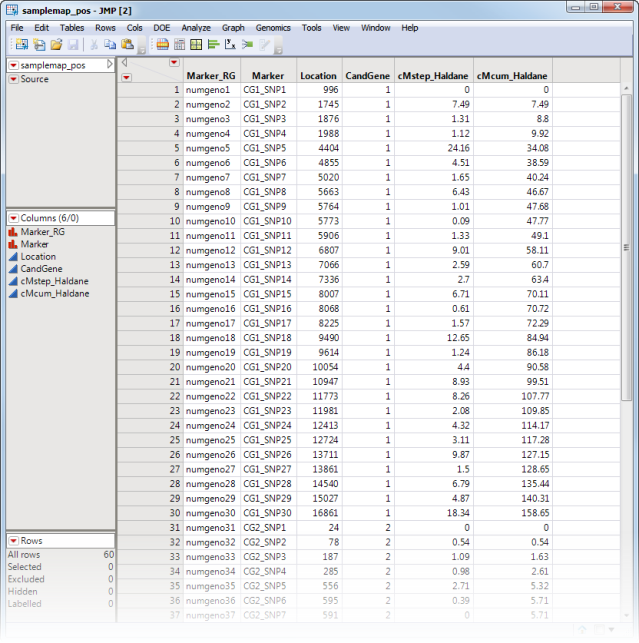
An optional Annotation Data Set containing a column with information on each marker and other relevant columns is also allowed, however, this data set is not used in the Genomic BLUP process; but instead it is passed on the follow-up Progeny Simulation process where it is used. A portion of the annotation data set used in the following example, the samplemap_pos data set, is illustrated below. This data set is a tall data set; each row corresponds to a different marker.

In addition, an optional Test Data Set can be specified to be scored by the model fitted to the Input SAS Data Set. The Test Data Set contains the data (that portion of the data that is set aside during model development) that can be used as test data to benchmark the fit and accuracy of the emerging predictive model. The Test Data Set must have the same predictor variables as the input data set. If it also has nonmissing values for the dependent variable, then results are produced comparing those values against predicted values.
Output/Results
The output generated by this process is summarized in a Tabbed report. Refer to the Genomic BLUP output documentation for detailed descriptions and guides to interpreting your results.