Process Description
Optimal Treatment Regime
The Optimal Treatment Regime follows the methodology of Zhang et al., (2012)1, fitting both a response regression model and a propensity score logistic model to the input data set. It combines results from these model fits to compute a pseudo binary response and weight (located in the output data in the Z_AIPWE, and W_AIPWE columns, respectively) that are suitable for input to predictive modeling routines. A contrast response (located in C_AIPWE) is also computed, and it can also be modeled or used directly to assign optimal treatment.
What do I need?
One wide format data set is required to run the Optimal Treatment Regime process. This data set must contain one column containing the dependent response variable, one column containing the treatment variable, and multiple columns to be used as predictor variables.
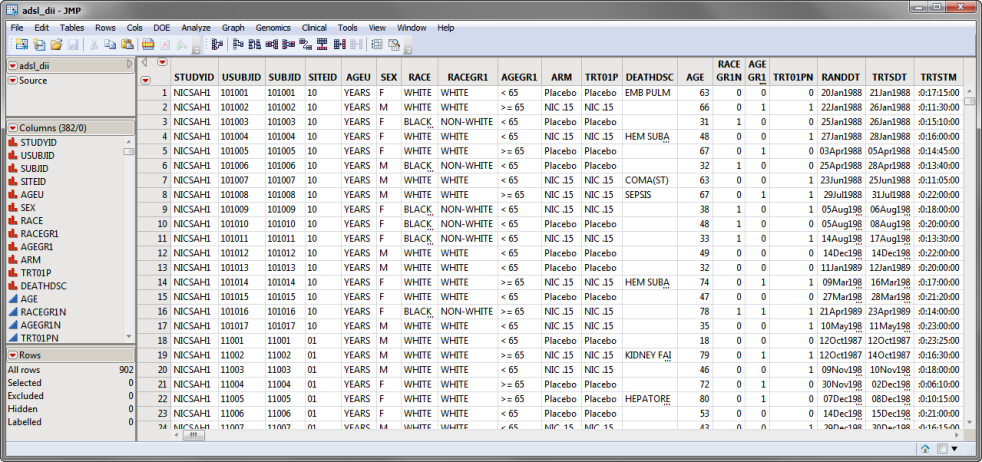
The adsl_dii.sas7bdat data set, partially shown below, details results for 902 subjects. Subjects are listed in rows, demographic information, trial details, and findings and results are listed in columns. The ARM column lists the treatment variable. The DEATHFL column lists the dependent variable. The predictor variables are spread across 310 columns.

For detailed information about the files and data sets used or created by JMP Genomics software, see Files and Data Sets.
Output/Results
Refer to the Optimal Treatment Regime output documentation for detailed descriptions of the output and guides to interpreting your results.