|
1.
|
|
2.
|
Select Graph > Contour Plot.
|
|
3.
|
|
4.
|
|
5.
|
Select to Fill Areas.
|
|
6.
|
Click OK.
|
|
a.
|
|
b.
|
Select Show Control Panel.
|
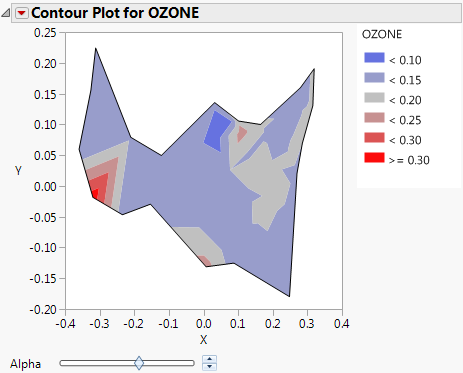
The Alpha slider appears.
Figure 7.10 Contour Plot for Ozone
|
8.
|
Click and move the Alpha slider to the right.
|
Figure 7.11 Alpha Shapes Filter

