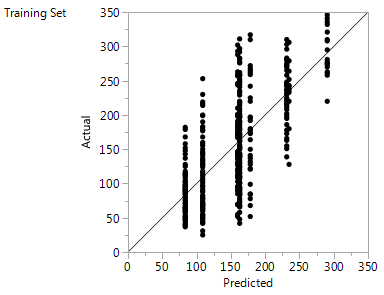
For continuous responses, the Actual by Predicted plot is the typical plot of the actual response versus the predicted response. When you fit a Decision Tree, all observations in a leaf have the same predicted value. If there are n leaves, then the Actual by Predicted plot shows at most n distinct predicted values. The actual values form a scatter of points around each leaf mean on n vertical lines.
- JMP 14.0 Online Documentation (English)
- Discovering JMP
- Using JMP
- Basic Analysis
- Essential Graphing
- Profilers
- Design of Experiments Guide
- Fitting Linear Models
- Predictive and Specialized Modeling
- Multivariate Methods
- Quality and Process Methods
- Reliability and Survival Methods
- Consumer Research
- Scripting Guide
- JSL Syntax Reference
- JMP iPad Help
- JMP Interactive HTML
- Capabilities Index
- JMP 13 Online Documentation
- JMP 12 Online Documentation
JMP Support support@jmp.com 800.450.0135 (US)
Documentation Feedback
Your feedback is important to us.
Email
us any comments about
our documentation.
Predictive and Specialized Modeling • Partition Models • Partition Platform Options • Actual by Predicted Plot
Help created on 7/12/2018
