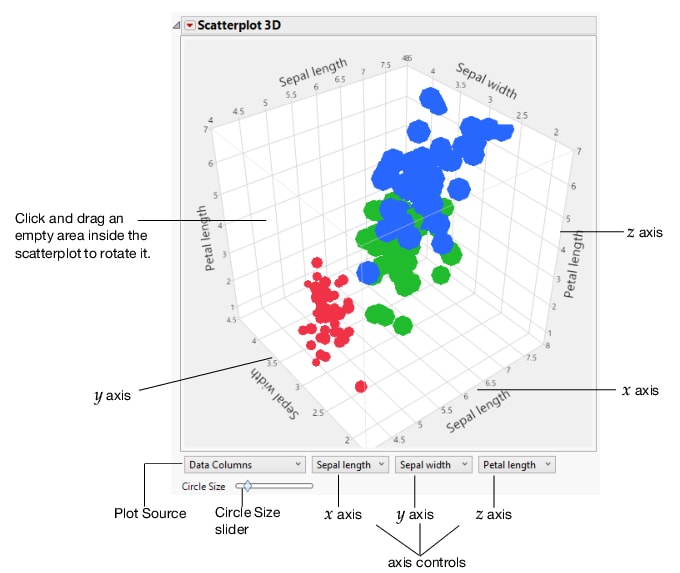
To produce the 3D scatterplot shown in Figure 5.4, follow the instructions in Example of a 3D Scatterplot.
The Scatterplot 3D report shows a three-dimensional spinnable view of your data. See Figure 5.4. In the launch window, you select the variables and then create the report. The variables are displayed on the 3D scatterplots’ x, y, and z axes. Up to three variables can be displayed at a time.
Click and drag the Circle Size slider to resize the balls while maintaining their relative sizes.
Select which variable appears on each axis. Choose the Other option to add a new variable.
