|
•
|
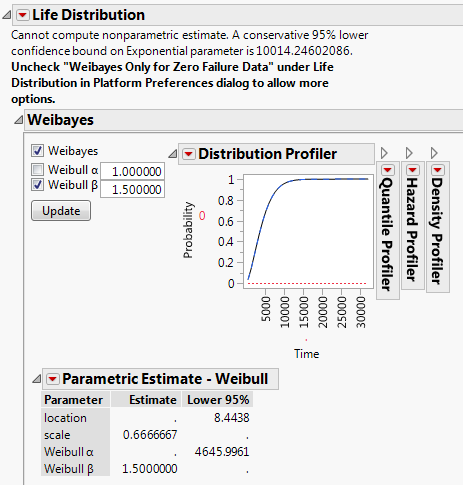
You have no failures (all observations are right-censored) and the preference Weibayes Only for Zero Failure Data is checked. Then the Weibayes report appears. See Weibayes Example for Data with No Failures.
|
|
•
|
|
1.
|
|
2.
|
|
3.
|
|
4.
|
|
5.
|
|
6.
|
Select Likelihood as the Confidence Interval Method.
|
|
7.
|
Click OK.
|
|
8.
|
Type 1.5 as the known Weibull β value.
|
|
9.
|
Click Update.
|
Figure 2.21 Life Distribution Report for Zero Failures
|
1.
|
|
2.
|
|
3.
|
|
4.
|
|
5.
|
|
6.
|
Select Likelihood as the Confidence Interval Method.
|
|
7.
|
Click OK.
|
|
8.
|
Select the Weibull distribution in the Compare Distributions plot.
|
|
9.
|
Select Fix Parameter from the Parametric Estimate - Weibull red triangle menu.
|
|
10.
|
|
11.
|
Type 1.5 as the known Weibull β value.
|
|
12.
|
Click Update.
|
|
14.
|
Place your cursor over the top of the Y axis. The cursor becomes a hand. Drag the axis downward until it reaches 0.5 as the top number.
|
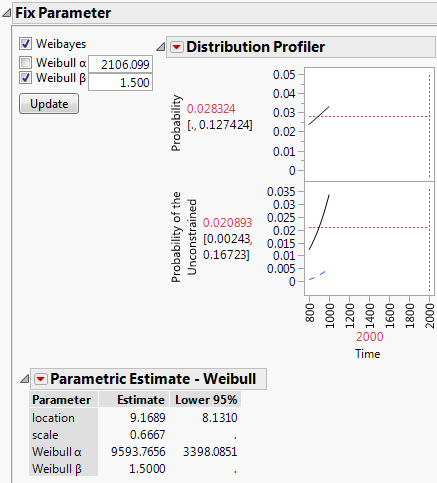
Figure 2.22 Life Distribution Report for One Failure

