The Parametric Survival - All Distributions Report
The Parametric Survival - All Distributions report appears only when you select All Distributions in the Fit Parametric Survival launch window. By default, this report contains a Model Comparison report and Distribution Overlay plot. The Quantile Function Overlay plot is available in the red triangle menu next to Parametric Survival - All Distributions.
Model Comparison
Table that lists fit statistics (AICc and BIC) for the fitted distributions. The distributions with the smallest AICc and BIC values are labeled in the right-most column. If one distribution has the smallest value for both AICc and BIC, that distribution is labeled “Best”. The Parametric Survival Fit report corresponding to the distribution with the smallest AICc is open by default. For more information about these statistics, see Likelihood, AICc, and BIC in Fitting Linear Models.
Distribution Overlay
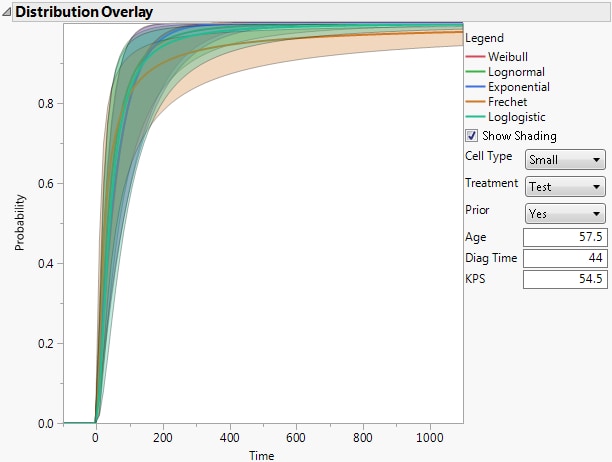
Plot of overlaid distribution functions for the fitted distributions at specified values of the effects.
Quantile Function Overlay
Plot of overlaid quantile functions for the fitted distributions at specified values of the effects.
Both the Distribution Overlay and Quantile Function Overlay plots show curves for each of the fitted distributions overlaid on the same graph. By default, each curve has a shaded Wald-based confidence interval. To the right of each plot, there is legend, an option to show shading of confidence intervals, and controls that enable you to specify different values of the effects. Figure 15.6 shows an example of a Distribution Overlay plot.
Note: You can change the α level for the shaded confidence intervals by selecting Set Alpha Level from the red triangle menu in the Fit Model launch window. The default α level is 0.05.
Figure 15.6 Distribution Overlay Plot
