Add Graphs or Images to Hover Labels Using Graphlets
Add a thumbnail of a related graph or an image to a hover label in a JMP graph using a graphlet. These graphs and images can have actions associated with them that are triggered by a mouse click. For example, you can click a graph to launch it, or click an image to open a related link.
Example of a Graphlet in Graph Builder
Click the JMP man graph shown in Figure 12.40 to open it in Graph Builder and customize the graph. See Customize Graphs in Using JMP for details about opening a graph in a platform, customizing the graph, and then saving the updated graph in the original graph.
Figure 12.40 Graphlet Example
The following script creates the graph and hover label that are shown in Figure 12.40.
Names Default To Here( 1 );
// open the data tabledt = Open( "$SAMPLE_DATA/JMP Man Dozen.jmp" );
// launch the baseline visualizationgb = Graph Builder(Size( 529, 466 ),
Show Control Panel( 0 ), Variables( X( :Data Set ), Y( :X ), Y( :Y, Position( 1 ) ) ),Elements(
Bar(
X,
Y( 1 ), Y( 2 ), Legend( 12 ), Error Interval( "Standard Deviation" ))
)
);
// get a reference to the visualization frameframe = (gb << Report)[FrameBox(1)];
/* use the "Set Graphlet" command to define the visualizationthat will be rendered inside the hover label using the"Picture" attribute */frame << Set Graphlet( /* The value of the "Picture" attribute is a JSL fragment that is evaluated to generate a thumbnail. The thumbnail is displayed inside the hover label. In this case, the hover label shows a scatterplot with a caption box. */Picture(
Graph Builder( Show Control Panel( 0 ),Variables( X( :X ), Y( :Y ) ),
Elements(
Points( X, Y, Legend( 1 ) ), Line Of Fit( X, Y, Legend( 3 ) ), Caption Box( X, Y, Legend( 4 ), Summary Statistic( "5 Number Summary" ) ))
)
/* Because the optional "Click" attribute is not defined, the "Picture" attribute script is re-used to launch the associated platform when the user clicks the graphlet thumbnail. */)
);
Example of a Graphlet in Principal Components
Create a graphlet in the Principal Components platform. When the user clicks the hover label, the Principal Components report window appears. The user can then explore and filter the data.
Figure 12.41 Prinicipal Components Graphlet
The following script creates the graphlet shown in Figure 12.41:
dt = Open( "$SAMPLE_DATA/Iris.jmp" );
gb = dt << Graph Builder(Size( 531, 451 ),
Show Control Panel( 0 ),Variables( X( :Species ), Y( :Sepal width ) ),
Elements( Treemap( X, Y, Legend( 4 ) ) ),SendToReport(
Dispatch(
{}, "Graph Builder",FrameBox,
{Set Graphlet(Picture(
Principal Components(Y( :Sepal length, :Sepal width, :Petal length,
:Petal width ),
Z( :Species ),
Estimation Method( "Default" ), "on Correlations")
)
)}
)
)
);
Graphlet Commands
Picture
A required script that adds a thumbnail of a graph or an image to the hover label.
Picture() is always executed in a Hover Label Execution Context derived from the current visual element. The first Picture Box (outside of a local data filter) found will be used to generate the displayed image.
If Picture() is a call to a platform, a local data filter is included.
...
Picture(
Graph Builder(
Show Control Panel( 0 ),
Variables( X( :X ), Y( :Y ) ),
Elements(
Points( X, Y, Legend( 1 ) ),
Line Of Fit( X, Y, Legend( 3 ) ),
Caption Box( X, Y, Legend( 4 ),
Summary Statistic( "5 Number Summary" ) )
)
) ...
See Add Graphs or Images to Hover Labels Using Graphlets for a complete example.
Click
An optional script for user-defined actions to be executed when the user clicks the associated image.
• Clicking runs the main graph’s platform (for example, Graph Builder), which launches in its own window.
• If Click is not provided, the script provided in Picture is evaluated in a Hover Label Execution Context scope.
Skip Filters
An optional script. By default, any code executed in the context of a hover label customization (such as a graphlet) executes in a context defined in the hovered visual element (for example, a bar in a bar chart). This context includes a local data filter based on the current visual role assignment, and it is usually what you want. However, in some rare cases, you don’t want the filter, or maybe part of the filter, so that the next graph generated by the graphlet can include more of the original data.
• If the Skip Filters field evaluates to a non-0 value (usually a positive integer such as 1) the selected Skip Filters Columns will be removed from the filter that will be applied to the new graphlet.
• Otherwise (for example, if it evaluates to 0), the selected columns are ignored and the filter is created as usual.
• If the Skip Filters Flag field is empty and no columns are selected in Skip Filters Columns (the default), then no columns are skipped when creating filters for the new window. Note that Skip Filters Flag is a JSL expression, which can be as complex as needed.
• If Skip Filters Flag field is not empty, but Skip Filter Columns is empty (no columns are selected), then all columns are filtered; the graphlet or new visualization includes all the data used by the original visualization. See Example of Defining the Context of a Scatterplot Matrix and Ellipse.
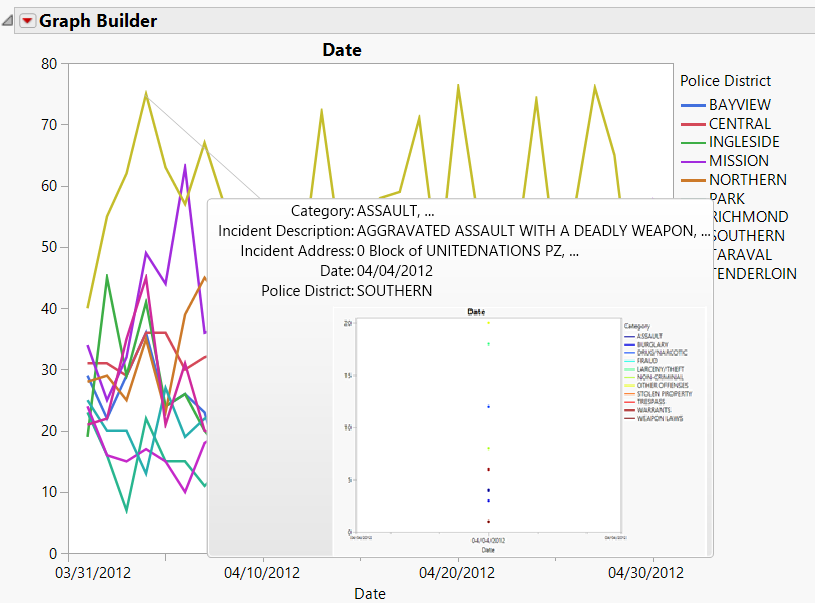
Suppose that you are looking at crime over time in the San Francisco Crime.jmp sample data table. You use a line chart where X = Date, an overlay of Police District, and no Y assignment. Lines represent counts over time per district. Now you want to use a graphlet to look at crime over time inside each district, broken down by category. Create this new graph and select Save > to Clipboard and then Paste Graphlet on the original graph to create the graphlet. However, the hovered graph shown in Figure 12.42 is not what you expect.
Figure 12.42 Initial Filtered Data
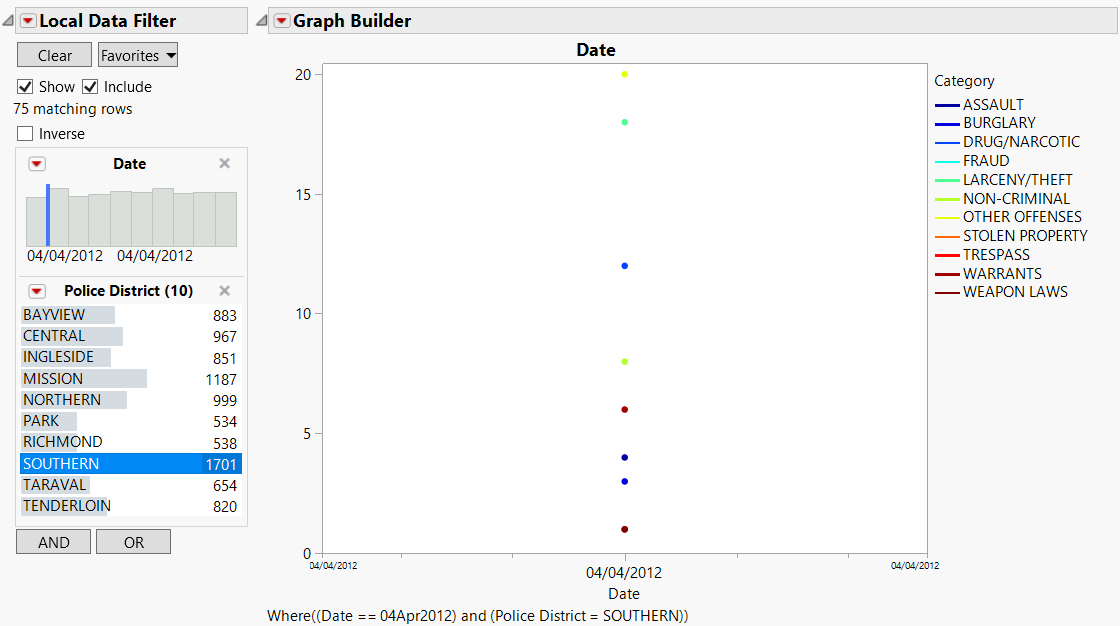
JMP created a filter based on both roles, X and the overlay. This is easier to see if you click on the graphlet to launch the new graph, and then expand the local data filter (on the left, collapsed by default). The filter on a single day causes the line chart to collapse into what looks like a marker plot as shown in Figure 12.43.
Figure 12.43 Local Data Filter with a Line Chart that Looks like a Marker Plot
You want the overlay value to restrict what you see in the new graph. However, you don’t want the date value to do so. You still want to filter by the “SOUTHERN” Police District, but you do not want to filter on “04/14/2012” Date.
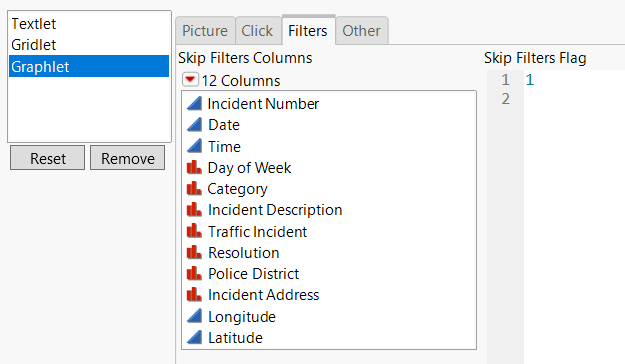
The solution is to use the Skip Filters Flag to remove the filter on Date from your original graph. On the Hover Label Editor, the script looks like this:
Figure 12.44 Example of Skip Filters Flag script in the Hover Label Editor
After the filter is removed, the end result is what you expect as shown in Figure 12.45.
Figure 12.45 Line Chart where Skip Filters Flag = 1
The following script creates the graph shown in Figure 12.45.
Names Default To Here( 1 );
dt = Open( "$SAMPLE_DATA/San Francisco Crime.jmp" );
gb = dt << Graph Builder(Size( 528, 456 ),
Show Control Panel( 0 ),Variables( X( :Date ), Overlay( :Police District ) ),
Elements( Line( X, Legend( 4 ) ) ),
SendToReport(
Dispatch(
{}, "Graph Builder",FrameBox,
{Set Graphlet(Picture(
Graph Builder(Size( 528, 456 ),
Show Control Panel( 0 ),Variables( X( :Date ), Overlay( :Category ) ),
Elements( Line( X, Legend( 1 ) ), Smoother( X,
Legend( 2 ) ) ))
),
Skip Filters( 1, {:Date} ))}
)
)
);
The Skip Filters Flag field holds an expression that is evaluated in the hovered visual element context. If expression evaluates to a truthful value (usually a positive integer such as 1), the selected “Skip Filters Columns” will be removed from the filter that will be applied to the new graphlet. Otherwise (for example, if it evaluates to zero), the selected columns are ignored and the filter is created as usual.
Title
Title is an expression that evaluates to a string. The result is the title that appears on the title bar of the window that contains the graph. Variables defined in the Hover Label Evaluation Context can be used in the Title expression.
For example, the following expression indicates the baseline visualization type and how many drilling levels have been used so far:
Title("Graphlet for " || local:_displaySegName ||", depth is " || Char( local:_drillDepth ))
If the Title expression is not specified, the new window is named “Graphlet”.
Note: In the JMP interface, Title is on the Hover Label Editor Other tab of a graphlet.
Reapply
Reapply is an expression that indicates whether the graphlet definition should be reapplied to new graphs or platforms created by clicking on a graphlet image. This is the core mechanism behind the ability to drill down using graphlets.
Reapply( local:_underlyingRows > 1 )
Note: In the JMP interface, Reapply is on the Hover Label Editor “Other” tab of a graphlet.
If Reapply is empty (the default setting), the graphlet definition is not reapplied. New windows launched by clicking on this graphlet doesn’t show graphlets on its hover labels.


