Additional Example of the Marker Statistics Platform
Learn how to calculate linkage statistics from your genetic data.
1. Select Help > Sample Data Folder > Life Sciences and open Genotypes Pedigree.jmp and Genotypes Pedigree Anno.jmp.
2. Select Analyze > Genetics > Marker Statistics.
3. Click on the Markers disclosure icon to show the Marker columns.
4. Select the first ten marker columns, and click Marker.
5. Select the same ten markers and click With Marker.
6. Check the Use Annotation Table check box.
7. Click OK.
8. In the Choose Annotation Table window, select the Genotypes Pedigree Anno.jmp annotation data table.
9. In the Annotation Specifications window, select Marker and click Marker Variables.
10. Select Gene and click Annotation Group.
11. Select Physical Position and click Annotation Position.
12. Click OK.
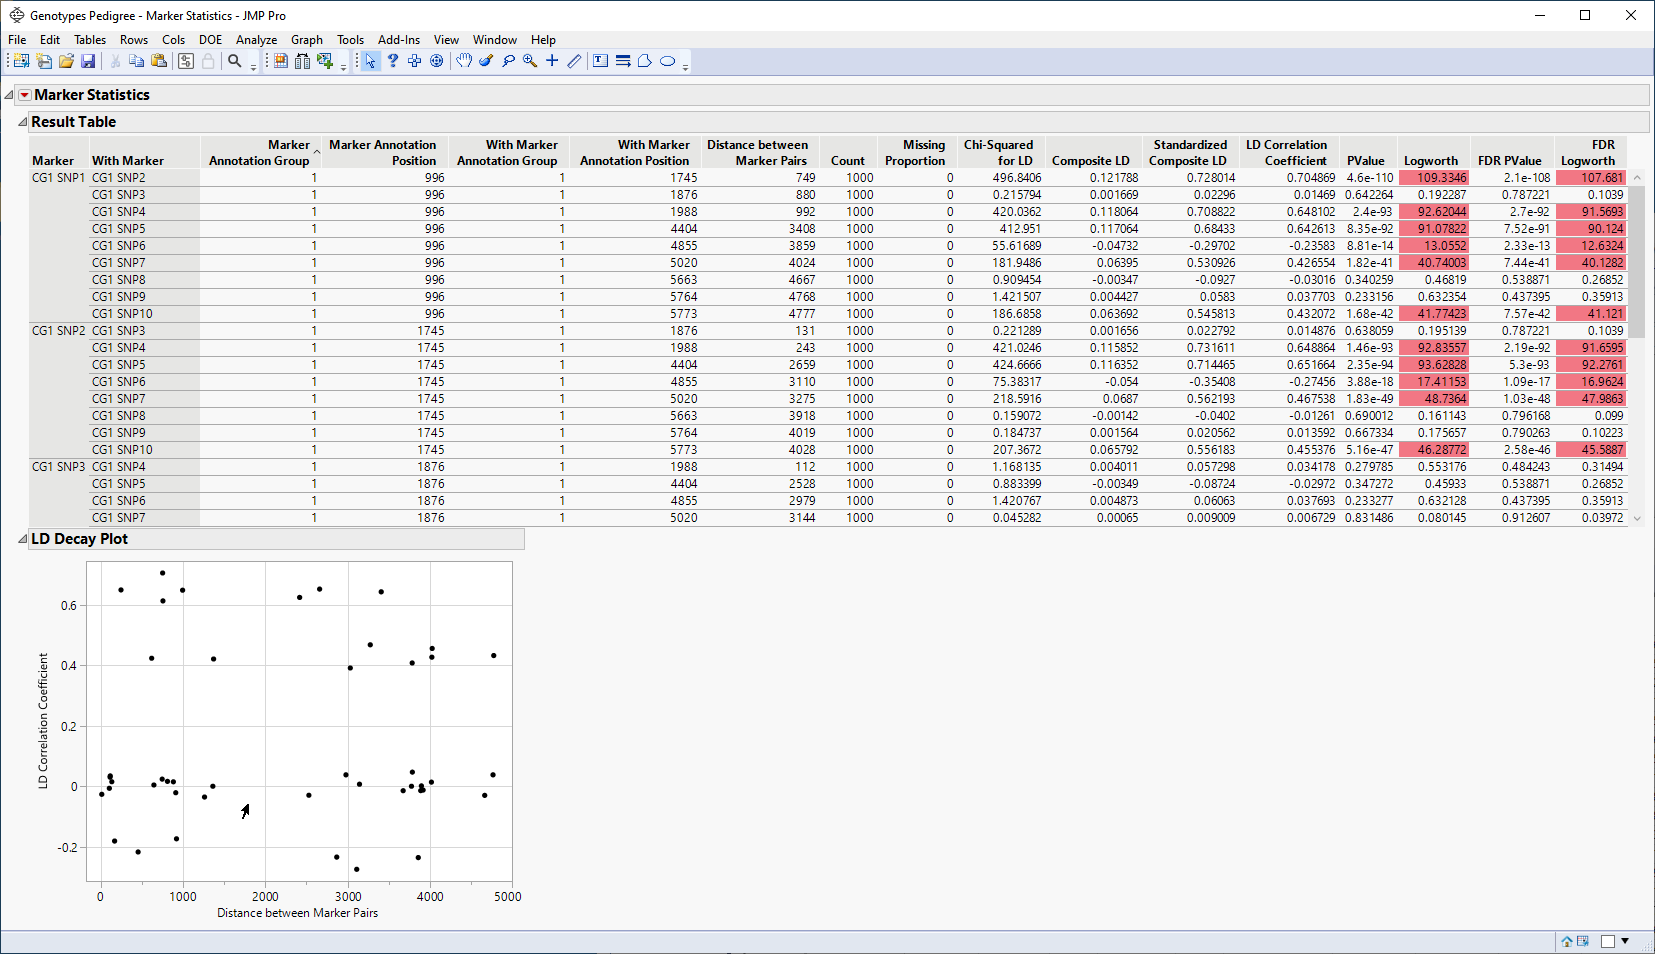
Figure 3.4 Analysis of Linkage Disequilibrium
In the Result Table, the values shown for each pair of markers are indicative of the strength of linkage disequilibrium between the pair. In the LD Decay Plot, you can see that linkage disequilibrium generally declines exponentially as the distance between the markers increases.
