Comparison Circles
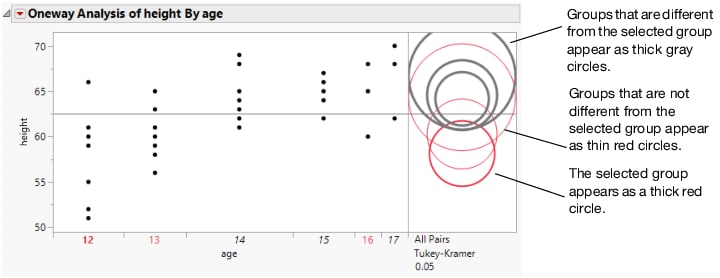
In the Oneway platform, each multiple comparison test, except for the Each Pair Stepwise, Newman-Keuls method, adds comparison circles to the Oneway plot. Comparison circles provide an interactive visual representation of group mean comparisons. Figure 6.8 shows the comparison circles for the All Pairs, Tukey HSD method. The radii of the circles are based on the test and significance level. See Statistical Details for Comparison Circles.
Figure 6.8 Visual Comparison of Group Means
Compare each pair of group means visually by examining the intersection of the comparison circles. The outside angle of intersection indicates whether the group means are significantly different (Figure 6.9).
• Circles for means that are significantly different either do not intersect, or intersect slightly, so that the outside angle of intersection is less than 90 degrees.
• If the circles intersect by an angle of more than 90 degrees, or if they are nested, the corresponding group means are not significantly different.
• Click a circle to highlight the corresponding group. Circles that are gray correspond to groups with means that are significantly different from the highlighted group (Figure 6.10). To deselect circles, click in the white space outside the circles.
Figure 6.9 Angles of Intersection and Significance
Figure 6.10 Highlighting Comparison Circles


