Example of Capturing a JMP Workflow
In this example, you have data on tips and bill amounts in restaurants. You want to create a workflow that does the following:
• Prepares the data by adding a formula and formatting values
• Adds a table showing bill amounts by day
• Adds a graph showing tip percentages by credit card type
You will then save and share the workflow.
Start Recording and Open Data
1. Select File > New > Workflow (Windows) or File > New > New Workflow (macOS).
2. Click Record  to start recording your actions.
Tip: This example starts recording before performing any steps, but you can capture steps after you have performed them. For details, see Example of Creating a Workflow from the Log History in Using JMP.
3. Select Help > Sample Data Folder and open Restaurant Tips.jmp.
Notice that a step to open the data table is recorded under the Workflow Steps.
Prepare Data
1. Highlight the Tip Percentage column and select Cols > Formula.
2. Click Tip Amount.
3. Click Divide ![]() .
.
4. Click Bill Amount.
Figure 7.21 Formula for Tip Amount by Bill Amount
5. Click OK.
6. Format the percentage values:
a. Highlight the Tip Percentage column and select Cols > Column Info.
b. Next to Format, click Best and choose Percent.
c. Click OK.
Add a Table
1. Click Analyze >Tabulate.
2. Drag Day of Week to the Drop zone for rows.
3. Drag Bill Amount into the values under N.
4. Click Done.
Figure 7.22 Table of Bill Amounts by Day
Notice that this step is not yet recorded in Workflow Builder. The step does not appear until you confirm that you have no further changes.
5. To confirm that the analysis is complete, close the Tabulate window.
Tip: Another way to add the step to Workflow Builder is to click the platform’s red triangle menu and select Save Script > To Workflow.
Add a Graph
1. Click Graph > Graph Builder.
2. Drag Credit Card to the X axis.
3. Drag Tip Percentage to the Y axis.
4. Click the Line of Fit element ![]() .
.
5. At left, under Line of Fit, select Prediction, RMSE, and R2.
Figure 7.23 Graph Builder Selections For Tip Percentage by Credit Card Type
6. Click Done.
Again, the step is not yet recorded in Workflow Builder.
7. To confirm that the graph is complete, close the Graph Builder window.
Stop Recording and Test the Workflow
Tip: You can perform these steps to test your workflow anytime. You can continue to edit the workflow after testing it.
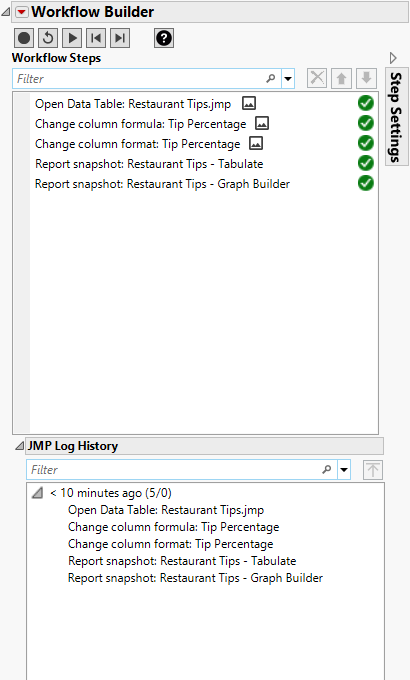
1. Click Record  to stop recording.
Figure 7.24 Workflow Builder with Steps and Log
2. Click Start Over ![]() to close any open windows in JMP.
to close any open windows in JMP.
3. Click Play ![]() to test and confirm the workflow.
to test and confirm the workflow.
Save the Workflow
1. Click File > Save.
JMP Workflows have the extension .jmpflow.
Tip: To add steps to a saved workflow, open the workflow in JMP and simply start recording again.
Share the Workflow
To share a workflow with a JMP user, you can send them the .jmpflow file and any associated data in a workflow package.
1. Click the Workflow Builder red triangle and select Create Workflow Package.
2. (Optional) Select the Presentation Mode option.
3. Click OK.
4. Navigate to the output path where you want to save the workflow package and specify a name for the workflow package.
5. Click Save.
6. On your computer, navigate to where you saved the workflow package. You can send this package to any JMP user.
There is a lot more you can do with workflows, such as add popup windows, hide data tables from analyses, and change the text of workflow steps. For more details, see “Save a JMP Workflow” in Using JMP.


