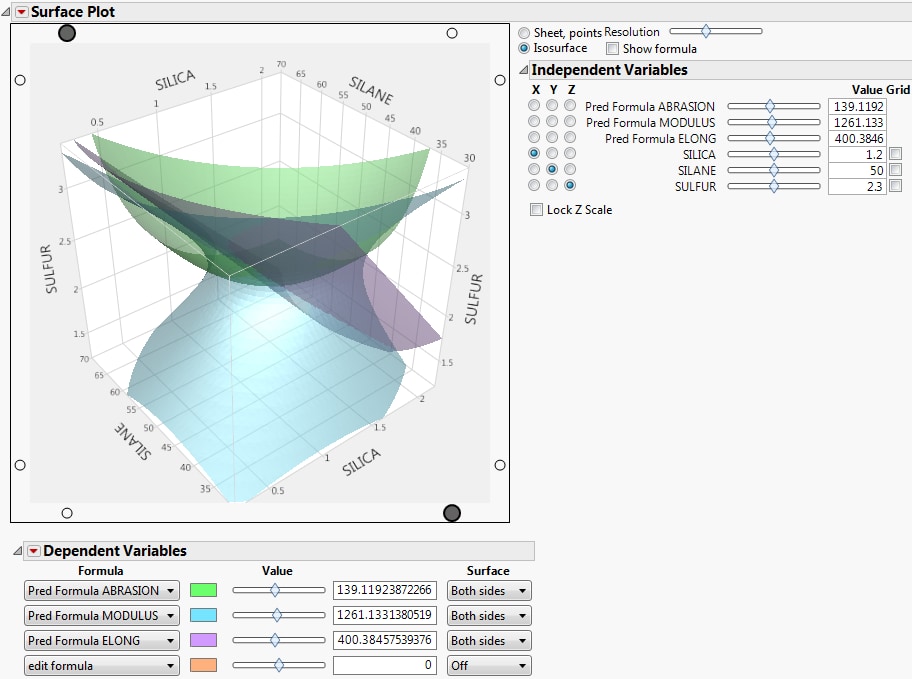
Example of Isosurfaces
In this example, the goal is to determine which values of a particular variable are inside the limits set by two surfaces. Isosurfaces are the 3-D equivalent to a 2-D contour plot. An isosurface requires a formula with three independent variables. The Resolution slider determines the n × n × n cube of points over which the formula is evaluated. The Value slider in the Dependent Variable section selects the isosurface (that is, the contour level) value.
1. Select Help > Sample Data Folder and open Tiretread.jmp.
2. Select Graph > Surface Plot.
3. Select Pred Formula ABRASION, Pred FormulaMODULUS, and Pred FormulaELONG and click Columns.
4. Click OK.
5. Select the Isosurface radio button in the appearance controls.
6. In the Dependent Variables report, select Both Sides from the Surface menu for all three variables.
Figure 5.14 Isosurface of Three Variables

For the tire tread data, one might set the abrasion at a fixed minimum setting and the elongation at a fixed maximum setting. Use the MODULUS slider to see which values of MODULUS are inside the limits set by the other two surfaces.