Publication date: 05/05/2023
Profilers
Introduction to Profilers
Visualize Response Surfaces and Optimize Processes
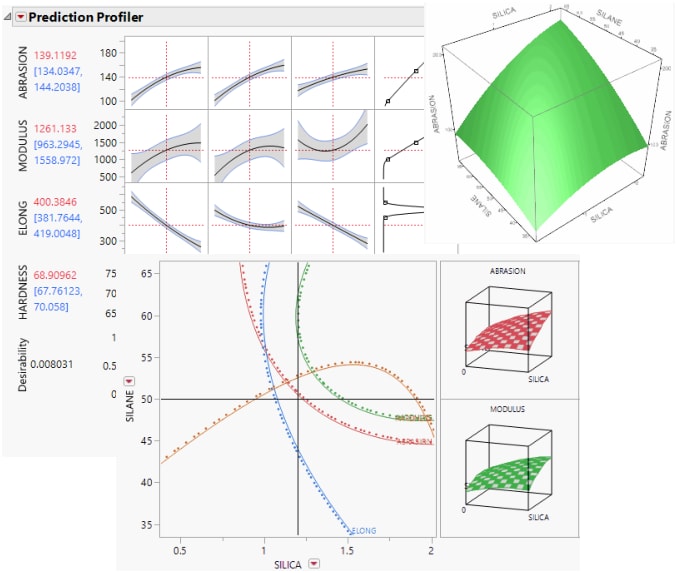
Profiling is an approach to visualizing response surfaces by seeing what would happen if you change just one or two factors at a time. Essentially, a profile is a cross-section view. Use the interactive profilers in JMP to exploring how changes in inputs impact your response(s). In fitting equations to data, the fitting is only the first step. Interpreting the fit, understanding the fitted response surface, and finding factor values to optimize the responses is desirable.
Figure 2.1 Examples of Profilers
Contents
Introduction to Profiling
Profiler Features in JMP
Profiler Launch Windows
Profilers in Fit Group Reports
Interpret Prediction Profiler
The Profiler as a Cross-Section
Set or Lock Factor Values
Profiler Platform Options
Common Profiler Topics
Linear Constraints
Noise Factors
Want more information? Have questions? Get answers in the JMP User Community (community.jmp.com).
