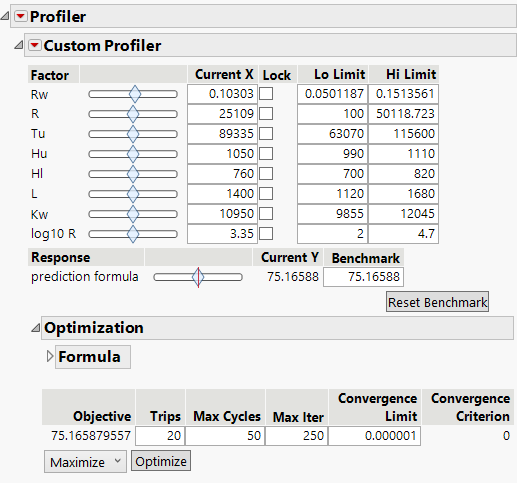
Example of the Custom Profiler
In this example, you want to optimize the predicted value of the response. The data demonstrates the flow of water through a borehole that is drilled from the ground surface through two aquifers.
1. Select Help > Sample Data Folder and open Design Experiment/Borehole Latin Hypercube.jmp
2. Select Graph > Custom Profiler.
3. Select prediction formula and click Y, Prediction Formula.
4. Click OK.
Figure 7.3 Custom Profiler Report
Note that the Benchmark value is 75.17. The Current Y value is also 75.17. This value is the predicted response with all factors set to their mean values.
You would like to find the X values of the factors that optimize the predicted value. However, of the factors in the model, only those related to the borehole can be manipulated in practice. The other factors are out of human control. You can lock the uncontrollable factors at their mean values and optimize the factors that can be controlled.
Note: To view the description of a factor, right-click the corresponding column in the data table and select Column Info.
5. In the Custom Profiler Report, select the Lock check box next to R, Tu, Hu, Hl, and log10 R.
6. In the Custom Profiler Report, click Optimize.
Figure 7.4 Optimized Custom Profiler Report
The optimization routine found an optimum predicted response at 221.66. In order to obtain the optimum of 221.66, Rw and Kw are set to their maximum values and L is set to its minimum value. The optimum is greater than the initial Benchmark value of 75.17.

