Example of the Process Capability Platform with Nonnormal Variables
In this example, you use the nonnormal capability features of the Process Capability platform to compute capability indices.
View the Distributions
1. Select Help > Sample Data Folder and open Process Measurements.jmp.
2. Select Analyze > Distribution.
3. Select all seven columns from the Select Columns list and click Y, Columns.
4. Check the box next to Histograms Only.
5. Click OK.
For most processes, the histograms show evidence that the theoretical distribution of measurements is skewed and does not follow a normal distribution. Therefore, for each process, you find the best fitting distributions among all of the available parametric distributions.
Perform a Capability Analysis
1. Select Analyze > Quality and Process > Process Capability.
2. Select all seven columns from the Columns list and click Y, Process.
3. Select all seven columns in the Y, Process list.
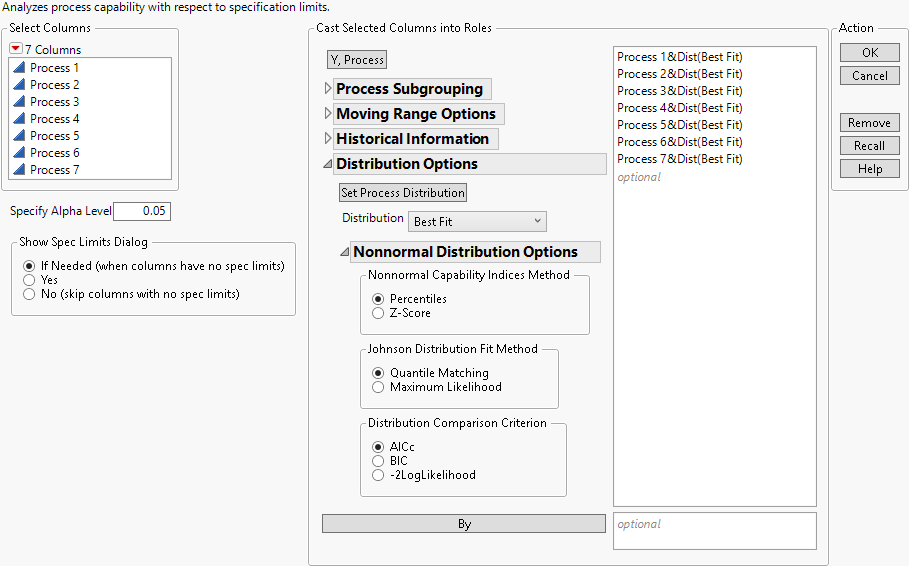
4. Open the Distribution Options panel and select Best Fit from the Distribution list.
5. Click Set Process Distribution.
The suffix &Dist(Best Fit) is added to each variable name in the Y, Process list. The Best Fit option specifies that the best-fitting parametric distribution should be fit to each variable. The available parametric distributions are Normal, Beta, Exponential, Gamma, Johnson, Lognormal, Mixture of 2 Normals, Mixture of 3 Normals, SHASH, and Weibull (Figure 9.3).
6. Open the Nonnormal Distribution Options outline. Note that the Nonnormal Capability Indices Method is set to Percentiles, the Johnson Distribution Fitting Method is set to Quantile Matching, and the Distribution Comparison Criterion is set to AICc.
Figure 9.3 Completed Launch Window
The Quantile Matching method is the default method used for fitting Johnson distributions because of its stability and speed as compared to Maximum Likelihood. Note that Maximum Likelihood is used in the Distribution platform.
7. Click OK.
8. Click the Goal Plot red triangle and select Label Overall Sigma Points.
9. Click the Capability Index Plot red triangle and select Label Overall Sigma Points.
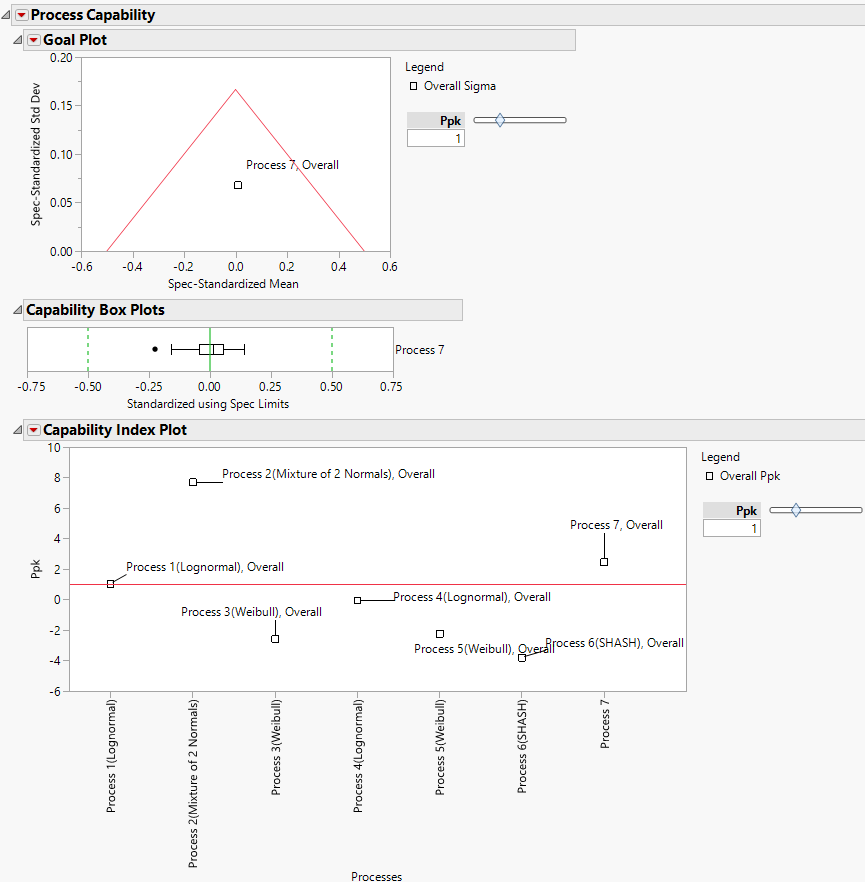
Figure 9.4 Initial Report with Variables Labeled
Note: Click a label in the plot and drag it to make the plot more interpretable. Click the right side frame of the Capability Index Plot and drag it to the right to make the labels easier to distinguish.
The Goal Plot shows only one point and it corresponds to Process 7. The Capability Box Plots report shows a single box plot for Process 7. This is because the best fit for Process 7 is a normal distribution.
10. To the right of the Capability Index Plot, set the Ppk value to 2.
The Capability Index Plot shows Ppk values for all seven processes. Only two processes, Process 2 and Process 7, have capability values that exceed 2. Note that the best fitting nonnormal distributions are shown in parentheses to the right of the variable names in the Capability Index Plot. The best fitting distribution for Process 7 is not shown because it is a normal distribution.
11. Click the Process Capability red triangle and select Individual Detail Reports.
Because you requested Best Fit in the launch window, the Compare Distributions option has been selected from each distribution’s red triangle menu.
12. Scroll to the report entitled Process 4(Lognormal) Capability.
Figure 9.5 Individual Detail Report for Process 4
The title of the report for Process 4 indicates that the capability calculations are based on a lognormal fit. All of the check boxes in the Compare Distributions report, except the boxes for Nonparametric and Beta, are checked, indicating that these nine distributions are fit. (This is because you requested a Best Fit in the launch window.) The button that is selected in the Selected column indicates that the Lognormal distribution is the distribution that is used in the remainder of the Process 4(Lognormal) Capability report to estimate capability and nonconformance.
The Compare Distributions report enables you to compare the nine distributional fits. The Histogram - Compare Distributions report gives a visual assessment of the fit and the Comparison Details report shows fit statistics for the selected distributions. Both the plot and the fit statistics indicate that the lognormal distribution gives the best fit among the selected distributions.
The Individual Detail Report information that is shown by default includes a histogram showing the estimated best-fit distribution, a summary of the process information, capability indices based on an overall estimate of sigma, parameter estimates for the fitted lognormal distribution, and observed and expected nonconformance levels.


