The Profiler as a Cross-Section
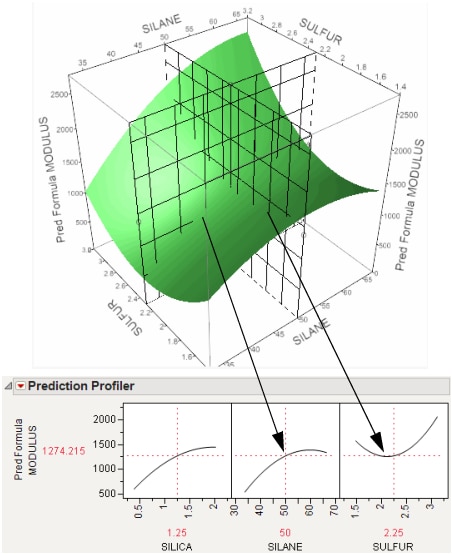
The profilers can display traces of a response surface in two dimensions. The traces are cross-sections of higher dimension surfaces. Consider a three dimensional response surface. Look at the response surface of the expression for MODULUS as a function of SULFUR and SILANE (holding SILICA constant). A superimposed grid helps to visualize the translation of the higher dimensions to the two dimensional traces.
Figure 2.4 Profiler as a Cross-Section
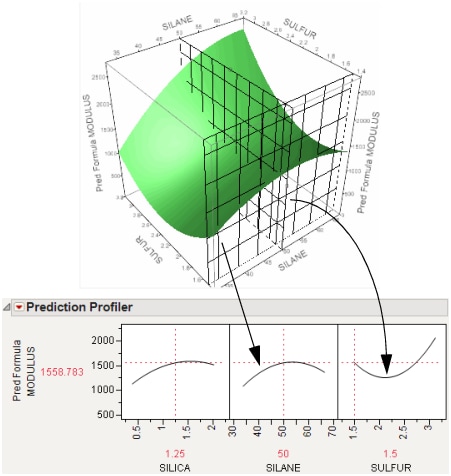
Now consider changing the current value of SULFUR from 2.25 to 1.5.
Figure 2.5 Profiler as a Cross-Section
In the Prediction Profiler, note the new setting for SULFUR while the SULFUR curve itself does not change. However, the profile trace for SILANE is now where SULFUR is set at 1.5. The profile for SILANE is now shifted higher and reaches its peak close to the current SILANE value of 50.

