Launch the Multiple Comparisons Option
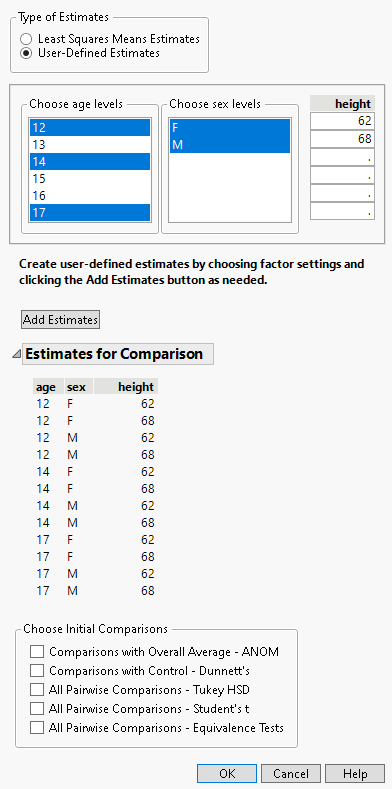
In the Fit Least Squares report, click the Response red triangle menu and select Multiple Comparisons. An example of the control window for the Multiple Comparisons option in Standard Least Squares is shown in Figure 3.53. This example is based on the Big Class.jmp data table, with weight as Y and age, sex, and height as model effects. Two classes of estimates are available for comparisons: Least Squares Means Estimates and User-Defined Estimates.
Least Squares Means Estimates
This option compares least squares means and is available only if there are nominal or ordinal effects in the model. Recall that least squares means are means computed at some neutral value of the other effects in the model. (For a definition of least squares means, see LSMeans Table.) You must select the effect of interest. In Figure 3.53, Least Squares Means Estimates for age are specified. There is an option to show the least squares means plot. See Least Squares Means Plot Options.
Figure 3.53 Launch Window for Least Squares Means Estimates
User-Defined Estimates
The specification of User-Defined Estimates is illustrated in Figure 3.54. Three levels of age and both levels of sex have been selected. Also, two values of height have been manually entered. The Add Estimates button has been clicked, which results in the listing of all possible combinations of the specified levels. At this point, you can specify more estimates and click the Add Estimates button again to add them to the Estimates for Comparison table.
Figure 3.54 Launch Window for User-Defined Estimates
When you use User-Defined Estimates, effects that have no specified levels are set as follows, according to their modeling type:
• Continuous effects are set to the mean of the effect.
• Nominal and ordinal effects are set to the first level in the value ordering.
Note: In this section, the term mean is used to refer to either estimates of least squares means or user-defined estimates.
Choose Least Squares Means Plot Options
Select the Show Least Squares Means Plot option to obtain a least square means plot. If your effect is an interaction term, then you have the option to create an interaction plot. You select the term for the overlay. If you do not select the interaction plot, then the least squares plot will nest the effect terms. See Least Squares Means Plot Options.
Choose Initial Comparisons
Once you have specified estimates, you can choose the types of comparisons that you would like to see in your initial report by making selections under Choose Initial Comparisons. Or click OK without making any selections.
Comparisons with Overall Average - ANOM
Compares each effect least squares mean with the overall least squares mean. (Analysis of Means).
Comparisons with Control - Dunnett’s
Compares each effect least squares mean with the least squares mean of a control level.
Tip: You can add a Control Level column property to the factor column to avoid specifying the control group each time you select Comparison with Control - Dunnett’s. See Control Level in Using JMP.
All Pairwise Comparisons - Tukey HSD
Tests all pairwise comparisons of the effect least squares means using the Tukey HSD adjustment for multiplicity.
All Pairwise Comparisons - Student’s t
Tests all pairwise comparisons of the effect least squares means with no multiplicity adjustment.
All Pairwise Comparisons - Equivalence Tests
Tests all pairwise comparisons of the effect least squares means against a specified difference that is deemed practically equivalent.
Each of these selections opens a report with an area at the top that shows details specific to the report. This information includes the quantile, or critical value. For the true multiple comparisons procedures, the method used for the multiple comparison adjustment is shown. For the equivalence tests, the structure of the tests is shown. If you have specified User-Defined Estimates, the report contains a list of effects that do not vary relative to the specified estimates and the levels at which these effects are set. Unless you have specified otherwise, any continuous effect is set to its mean. Any nominal or ordinal effect is set to the first level in its value ordering.
If you click OK without selecting from the Choose Initial Comparisons list, the Multiple Comparisons report opens, showing the Least Squares Means Estimates table or the User-Defined Estimates table. From the Multiple Comparison red triangle menu, all of the options listed above are available. The available reports and options are described below.
Least Squares Means or User-Defined Estimates Report
By default, the Multiple Comparisons option displays a Least Squares Means Estimates report or a User-Defined Estimates report, depending on the type of estimates that you selected in the Multiple Comparisons launch window. For each combination of levels of interest, this table gives an estimate of the mean, as well as a test and confidence interval. Specifically, this table contains the following columns:
Levels of the Categorical Effects
The first columns in the report identify the effect or effects of interest. The values in the columns specify the groups being analyzed.
Estimate
An estimate of the mean for each group.
Std Error
The standard error of the mean for each group.
DF
The degrees of freedom for a test of whether the mean is 0.
Lower 95%
The lower confidence limit for the mean. You can change the confidence level by selecting Set Alpha Level in the Fit Model window.
Upper 95%
The upper confidence limit for the mean.
t Ratio
(Appears only if you right-click in the report and select Columns > t Ratio.) The t ratio for the significance test.
Prob>|t|
(Appears only if you right-click in the report and select Columns > Prob>|t|.) The p-value for the significance test.
Arithmetic Mean Estimate
(Appears only in the Least Squares Means Estimates report.) An estimate of the arithmetic mean for each group.
N
(Appears only in the Least Squares Means Estimates report.) The number of observations used to calculate the mean for each group.

