Nonpar Density Report
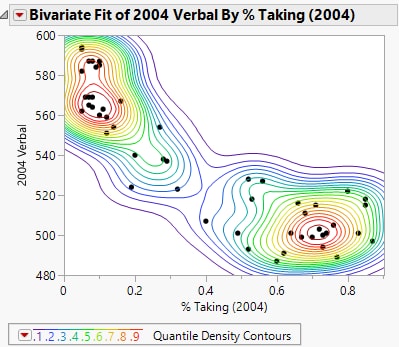
In the Bivariate platform, use the Nonpar Density option to fit a smooth nonparametric bivariate surface to your data. The nonparametric density fit is visualized using a set of contours. The contours are in 5% intervals. This means that about 5% of the points generated from the estimated nonparametric distribution are within the innermost contour, 10% are within the next contour, and so on. The outermost contour contains about 95% of the points.
Figure 5.14 Example of Nonpar Density
To change the size of a nonparametric density contour grid, press Shift and select Nonpar Density from the Bivariate red triangle menu. Enter a larger value than the default 102 points.
For more information about the options in the Quantile Density Contours menu, see Bivariate Fit Options.
Tip: When you have a large number of data points, use the Nonpar Density (nonparametric density) option to view patterns in the scatterplot.
The Quantile Density Contours report contains a table of the standard deviations used in creating the nonparametric density.
Variable
The names of the variables used in creating the contours.
Kernel Std
The kernel band width. The initial value is based on the standard deviation of the variable. Adjust the slider to increase or decrease the density of the contours.
