Right-Click Menus
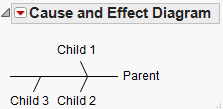
In the Cause and Effect Diagram, right-click a highlighted node to modify text, insert new nodes, change the diagram type, and more. Note the following:
• Right-click a title to change the font and color, positioning, visibility, or formatting.
• Click and highlight a node to rename it.
• Click and drag a node to move it.
Text Menu
The Text menu contains the following options:
Font
Select the font of the text or numeric characters.
Color
Select the color of the text or numeric characters.
Rotate Left, Rotate Right, Horizontal
Rotates the text or numbers to be horizontal, 90 degrees left, or 90 degrees right.
Insert Menu
Use the Insert menu to insert items onto existing nodes. The Insert menu contains the following options:
Before
Inserts a new node to the right of the highlighted node. For example, Figure 16.6 inserts Child 1.5 before Child 2.
Figure 16.6 Insert Before
After
Inserts a new node to the left of the highlighted node. For example, Figure 16.7 inserts Child 3 after Child 2.
Figure 16.7 Insert After
Above
Inserts a new node at a level above the current node. For example, Figure 16.8 inserts Grandparent at a level above Parent.
Figure 16.8 Insert Above
Below
Inserts a new node at a level below the current node. For example, Figure 16.9 inserts Grandchild at a level below Child 2.
Figure 16.9 Insert Below
Move Menu
Use the Move menu to move nodes or branches. The Move menu contains the following options:
First
Moves the highlighted node to the first position under its parent.
Last
Moves the highlighted node to the last position under its parent.
Other Side
Moves the highlighted node to the opposite side of its parent line.
Force Left
Makes all horizontally drawn elements appear to the left of their parent.
Force Right
Makes all horizontally drawn elements appear to the right of their parent.
Force Up
Makes all vertically drawn elements appear above their parent.
Force Down
Makes all vertically drawn elements appear below their parent.
Force Alternate
Draws children on alternate sides of the parent line.
Figure 16.10 Force Options
Other Menu Options
The right-click menu for a highlighted node also contains these options:
Change Type
Changes the entire chart type to Fishbone, Hierarchy, or Nested.
Uneditable
Disables all other commands except Move and Change Type.
Text Wrap Width
Specifies the width of labels where text wrapping occurs.
Make Into Data Table
Converts the currently highlighted node into a data table. Convert the all nodes by highlighting the whole diagram (effect).
Close
Shows the highlighted node.
Delete
Deletes the highlighted node and all of its children.


