Statistical Details for Propagation of Error Bars
Propagation of error (POE) is important when attributing the variation of the response in terms of variation in the factor values when the factor values are not very controllable.
In JMP’s implementation, the Prediction Profiler first looks at the factor and response variables to see whether there is a Sigma column property (a specification for the standard deviation of the column, accessed through the Cols > Column Info dialog box). If the property exists, then the Prop of Error Bars command becomes accessible in the Prediction Profiler drop-down menu. This displays the 3σ interval that is implied on the response due to the variation in the factor.
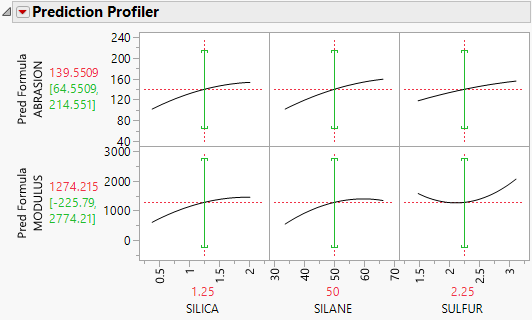
Figure 3.43 Green Propagation of Errors Bars in the Prediction Profiler
The POE is represented in the graph by a green bracket. The bracket indicates the prediction plus or minus three times the square root of the POE variance. The POE variance can be expressed as follows:

where σy is the user-specified sigma for the response column, and σx is the user-specified sigma for the factor column.
Currently, these partial derivatives are calculated by numerical derivatives:
centered, with δ=xrange/10000
POE limits increase dramatically in response surface models when you are over a more sloped part of the response surface. One of the goals of robust processes is to operate in flat areas of the response surface so that variations in the factors do not amplify in their effect on the response.
