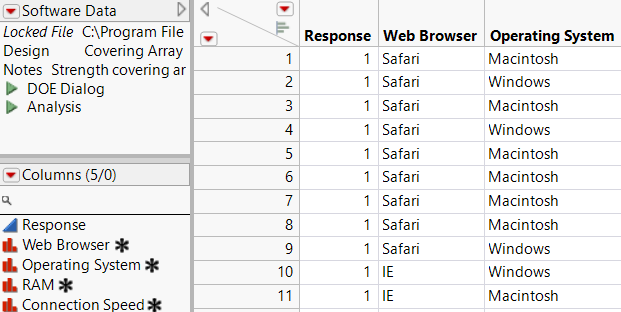
 The Covering Array Data Table
The Covering Array data table contains a first column where you can enter the response. The remaining columns give the factor settings.
The Table panel in the upper left contains a Design note indicating that the design is a Covering Array and giving the Strength of the design. The Table panel also contains the following scripts.
DOE Dialog
Re-creates the Covering Array window that you used to generate the design table.
Disallowed Combinations
Shows factor level restrictions that you entered in the Restrict Factor Level Combinations section.
Analysis
Provides an analysis of your experimental data. For more information about the script, see Analysis Script. For background, see Zhang and Zhang (2011).
Tip: To run a script, click the green triangle next to the script name.
Figure 21.21 Partial View of Covering Array Table for Software Data.jmp Showing Scripts
 Analysis Script
The Analysis script assumes the following about the Response column:
• The responses are recorded as 0 for failure and 1 for success.
• Missing values are permitted.
• The Response column is continuous.
• You can rename or move the Response column.
The Analysis script produces a report with two sections:
• The Summary section gives the number of runs resulting in Success, Failure, and the number of runs for which the response is Missing.
• The Failure Analysis Details report contains a <k> Factor Interactions report. The value of k is the smallest number of interactions that detect a failure. (For a definition of detect, see Covering Arrays and Strength.) The three columns contain the following:
– The Factors column lists all k-factor combinations that detect failures.
– The Failure Levels column lists the values of the k factors in the Factors column that detect failures.
– The Failure Count column gives the number of failures corresponding to the k-factor combination of Failure Levels.
Note: A failure observation can appear in more than one of the k-factor combinations listed in the Failure Levels column.
The rows in the <k> Factor Interactions report are dynamically linked to the data table. If you select one or more rows in the report, the corresponding rows are selected in the data table.
