The Nonlinear Fit Report
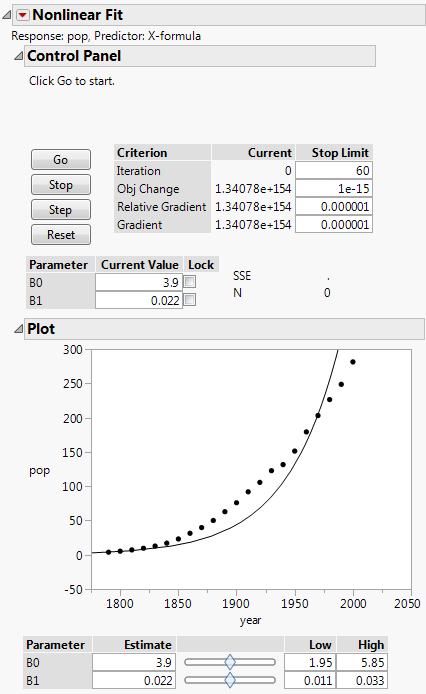
The initial Nonlinear Fit report includes the Control Panel and Plot, shown in Figure 15.6.
Control Panel
Provides options for controlling the fitting process.
Go
Starts the fitting process.
Stop
Stops the fitting process.
Step
Proceeds through the fitting process one iteration at a time.
Reset
Resets the editable values into the formula, resets the iteration values, and calculates the SSE at these new values.
Criterion
Shows iteration measures from the fitting process.
Current
Shows the current value of each Criterion.
Stop Limit
Sets limits on the measures listed under Criterion.
Plot
Shows a plot of the X and Y variables for models with only one X variable. The model based on the current values is shown on the plot. To change the current values of the parameters, use the sliders or edit boxes beneath the plot.
Figure 15.6 Initial Nonlinear Fit Report
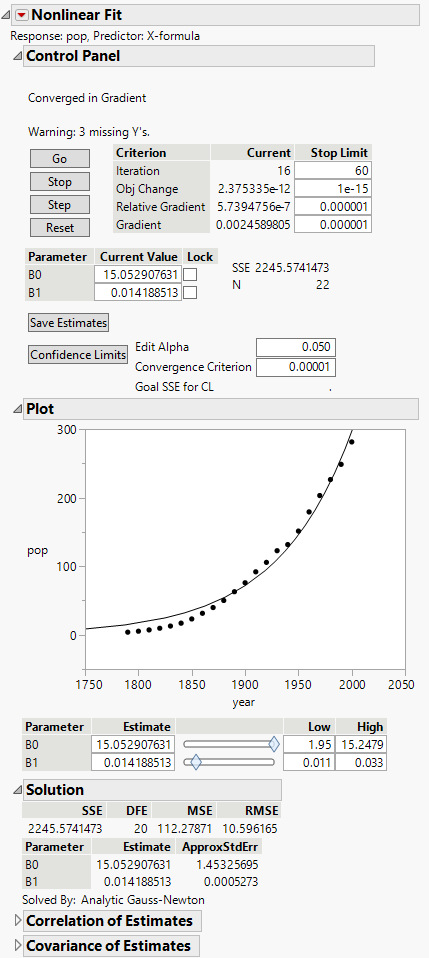
After you click Go to fit a model, the report includes the following additional items, shown in Figure 15.7.
Save Estimates
Saves the current parameter values to the parameters in the formula column.
Confidence Limits
Computes confidence intervals for all parameters. The intervals are profile likelihood confidence intervals, and are shown in the Solution report. The confidence limit computations involve a new set of iterations for each limit of each parameter, and the iterations often do not find the limits successfully. The Edit Alpha and Convergence Criterion options are for the confidence interval computations. For more information about the Goal SSE for CL, see Statistical Details for Profile Likelihood Confidence Limits.
Solution
Shows the parameters estimates and other statistics.
SSE
Shows the residual sum of squared errors. SSE is the objective that is to be minimized. If a custom loss function is specified, this is the sum of the loss function.
DFE
Shows the degrees of freedom for error, which is the number of observations used minus the number of parameters fitted.
MSE
Shows the mean squared error. It is the estimate of the variance of the residual error, which is the SSE divided by the DFE.
RMSE
Estimates the standard deviation of the residual error, which is square root of the MSE.
RSquare
(Available only if the model has an intercept and the sum of the residuals is close to zero.) Shows the RSquare value.
Parameter
Lists the names that you gave the parameters in the fitting formula.
Estimate
Lists the parameter estimates produced. Keep in mind that with nonlinear regression, there might be problems with this estimate even if everything seems to work.
ApproxStdErr
Lists the approximate standard error, which is computed analogously to linear regression. It is formed by the product of the RMSE and the square root of the diagonals of the derivative cross-products matrix inverse.
Note: If the number of observations is less than or equal to the number of parameters in the fitted model, ApproxStdErr is not reported.
Lower CL and Upper CL
Shows the confidence limits for the parameters. They are missing until you click the Confidence Limits on the Control Panel. For more information about the confidence intervals, see Statistical Details for Profile Likelihood Confidence Limits.
Excluded Data
Shows a report showing fit statistics for excluded rows. This is useful for validating the model on observations not used to fit the model. You can use this feature in conjunction with the Remember Solution option to change the exclusions, and get a new report reflecting the different exclusions
Correlation of Estimates
Displays the correlations between the parameter estimates.
Covariance of Estimates
Displays the covariances between the parameter estimates.
Figure 15.7 Fitted Model Report

