Additional Example of K Means Clustering
This example uses a Self-Organizing Map (SOM) to cluster observations of irises into their correct species.
1. Select Help > Sample Data Folder and open Iris.jmp.
2. Select Analyze > Clustering > K Means Cluster.
3. Select Sepal length, Sepal width, Petal length, and Petal width and click Y, Columns.
4. Click OK.
5. Select Self Organizing Map from the Method menu on the Control Panel.
6. Set N Rows equal to 1 and N Columns equal to 2.
7. Click Go.
8. Open the Control Panel Report.
9. Set N Rows equal to 1 and N Columns equal to 3.
10. Click Go.
11. Open the Control Panel Report.
12. Set N Rows equal to 2 and N Columns equal to 2.
13. Click Go.
Figure 14.10 SOM Cluster Comparison
The Cluster Comparison report appears at the top of the report window. The best fit is determined by the highest CCC value. Notice the number of clusters that gives the largest CCC is 3, which is the number of species.
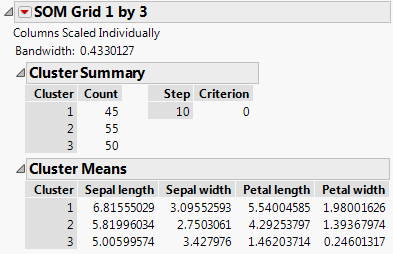
14. Scroll to the SOM Grid 1 by 3 report. The classification was not perfect; each cluster should represent each species, with 50 rows for each.
Figure 14.11 Self-Organizing Map Report for Iris.jmp
15. In the data table, select the Species column and select Rows > Color or Mark by Column.
16. Select the Classic option under Markers.
17. Click OK.
18. Click the red triangle menu next to SOM Grid 1 by 3 and select Biplot.
19. Click the red triangle menu next to SOM Grid 1 by 3 and select Biplot Options > Show Biplot Rays.
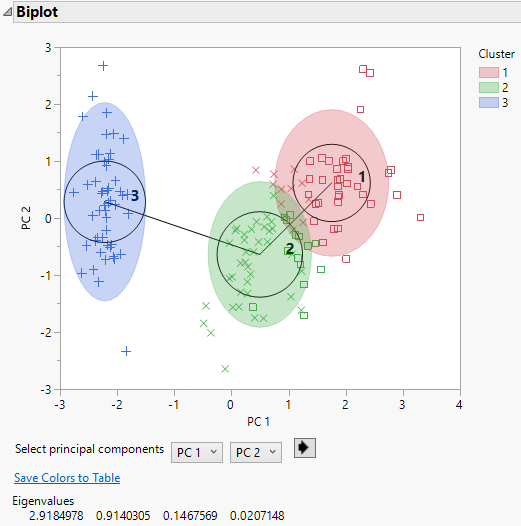
Figure 14.12 SOM Biplot
Figure 14.12 shows that all rows from Cluster 3 are correctly identified as the setosa species. The other two species, virginica and versicolor, overlap slightly and can be mistaken for each other.


