 Additional Example of the Association Analysis Platform
In this example, you use singular value decomposition of the transaction item matrix to analyze transactional data reported by a grocery store. The data contains information for items purchased by 1001 customers.
1. Select Help > Sample Data Folder and open Grocery Purchases.jmp.
2. Select Analyze > Screening > Association Analysis.
3. Select Product and click Item.
4. Select Customer ID and click ID.
Note: Each of the 1001 customers is assigned a unique custom ID.
5. Click OK.
6. Click the Association Analysis red triangle and select SVD.
7. Click OK.
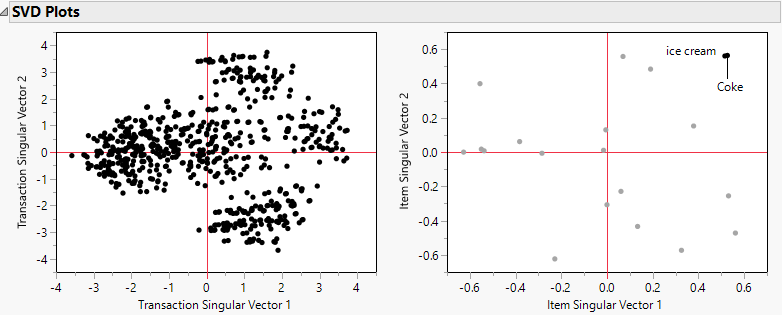
Figure 26.5 SVD Plots
The transaction SVD plot suggests that there might be two or three groups of transactions. In the upper right corner of the item SVD plot, notice that the points that represent Coke and ice cream overlap. The proximity of these two items indicates that there is a strong affinity between them.
8. Click the SVD red triangle and select Topic Analysis, Rotated SVD.
9. Type 3 next to Number of topics (rotated singular vectors) and click OK.
The Topic Items and Topic Scores reports appear.
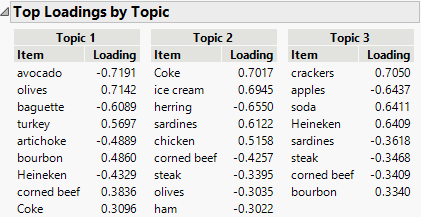
Figure 26.6 Topic Items Report
Three groups, or topics, are created and shown in the Topic Items report. The first items listed in the Topic Item tables represent the primary items for that group. For example, Topic 1 is a group that is identified primarily by transactions that do not contain avocados, but do contain olives.
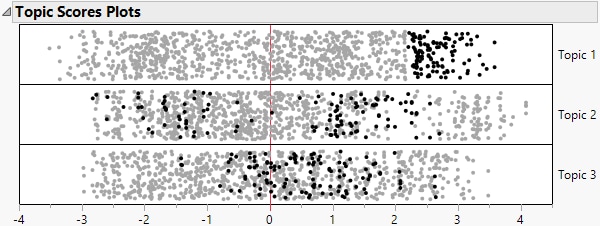
Figure 26.7 Topic Scores
The topic scores that are assigned to each of the 1001 transactions are plotted in the Topic Scores report. Select groups of points for a topic to see how those transactions relate to other topics. For example, transactions with very high values on Topic 1 tend to have low values on Topics 2 and 3.
10. Open the Singular Values report.
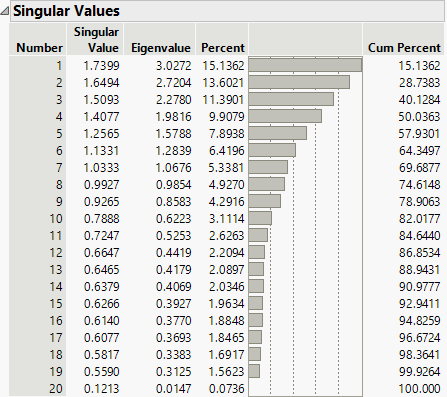
Figure 26.8 Singular Values Table
As seen in Figure 26.8, the first two singular values explain only about 30% of the variability in the grocery store data. Additional dimensions might be required to explain a sufficient amount of variability.


