Analyze the Pilot Study Data
Now that the choice design pilot survey is complete, it is administered to a single respondent. The respondent chooses one profile from each set, entering 1 for the chosen profile and 0 for the rejected profile. You will analyze the results using the Choice platform.
Note: For more information about the Choice platform, see “Choice Models” in Consumer Research.
1. Select Help > Sample Data Folder and open Design Experiment/Laptop Design.jmp.
2. Run the Choice script.
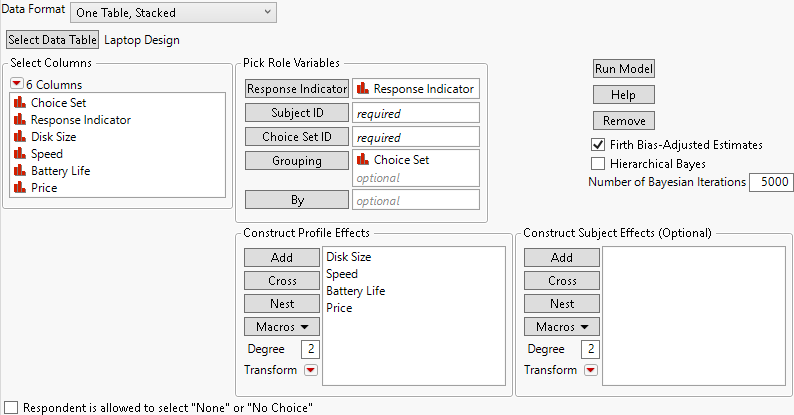
Figure 18.6 Choice Model Launch Window
The only grouping variable is Choice Set because there is a single survey and a single respondent.
3. Click Run Model.
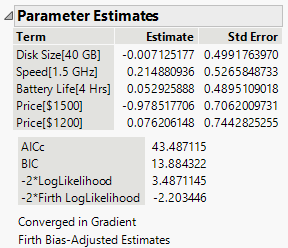
Figure 18.7 Parameter Estimates for Pilot Survey
To construct the final choice design that you will give to ten respondents, you need prior means and variances for the parameter estimates. The analysis in Figure 18.7 gives estimates of the parameter means (Estimate) and estimates of their standard errors (Std Error). You will treat the standard errors as prior estimates of the standard deviations. Next, to calculate estimates of the variances of the attributes, construct a JMP table and square the standard errors.
4. Right-click in the Parameter Estimates report and select Make into Data Table.
5. In the new data table, right-click in the Std Error column header and select New Formula Column > Transform > Square.
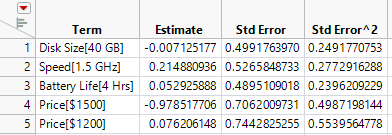
A column called Std Error^2 is added to the data table. Its values will serve as your estimates of the prior variance for the choice model parameters.
Figure 18.8 Untitled Data Table with Variance Estimates in Last Column
Note: Do not close the Untitled data table at this point.


