Customize a Contour Plot
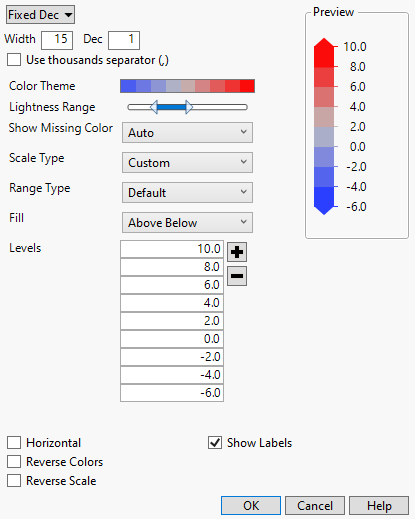
If you do not select options in the Contour Plot launch window, the default plot spaces the contour levels equally within the range of the Y variable. You can specify a color theme by selecting a Continuous Color Theme in File > Preferences > Graphs. You can customize colors for individual contours by right-clicking on the contour color in the Contour Plot legend. You can customize the entire contour color gradient by right-clicking on the Contour Plot legend and selecting Gradient to open the Gradient Settings.
Figure 10.7 Gradient Settings Window
To format the labels in the legend, use the format menu, Width and Dec boxes, and the Use thousands separator (,) check box in the top left of the window.
Color Theme
Changes the color theme or defines a custom color theme. For more information about color options, see “Create Color Themes in Graphs” in Using JMP.
Lightness Range
Sets the range of intensities for the gradient coloring.
Number of Labels
(Not available if the Scale Type is Custom.) Specifies the number of labels for your legend. The value of zero provides the default number of labels.
Show Missing Color
Specifies whether to show missing color in the legend. Auto shows the color only when there are missing values, Off never shows the color, On always shows the color.
Scale Type
Sets the scale for the gradient coloring. A description of the scale type is found below the Maximum value setting.
Linear
The scale is piecewise linear between the Minimum and Center values and between the Center and Maximum values. This is the default scaling.
Quantile
The scale is piecewise linear for quantiles of the gradient variable.
Standard Deviation
The gradient variable range is divided into standard deviation offsets from the mean. The scale is piecewise linear between these offset settings. The number of offsets is determined by the Number of Labels.
Log
The scale is linear for the logarithm of the gradient variable.
Log Offset
The scale is linear for the offset of the base 10 logarithm of the gradient variable.
Custom
The scale labels are specified by the user in the Levels setting.
Range Type
Sets the range of the legend values.
Default
Unless you specify values for the Minimum and Maximum, the minimum and maximum values include the range of the data and are chosen to be appropriately rounded values.
Exact Data Range
The minimum and maximum values are the exact minimum and maximum values for the data, or they are the values that you specify as Minimum and Maximum.
Middle 90%
The minimum and maximum values are the 5th and 95th quantiles, or they are the values that you specify as Minimum and Maximum. This option is resistant to outliers.
Fill
Determines how the endpoints of the range are specified in the contours.
Between
The contours stop at the endpoint and any data beyond the endpoint is not shown.
Above
Values above the range are included in the top contour level.
Below
Values below the range are included in the bottom contour level.
Above Below
Values at either end are included in their respective contour levels.
Levels
(Available only when the Custom Scale Type is specified.) Enables you to specify the number of labels and the label values for the legend.
Horizontal
Sets the orientation of the legend to horizontal.
Reverse Colors
Reverses the colors in the color scheme.
Reverse Scale
Reverses the scale for the color theme.
Show Labels
Shows or hides labels for the legend.
Specify
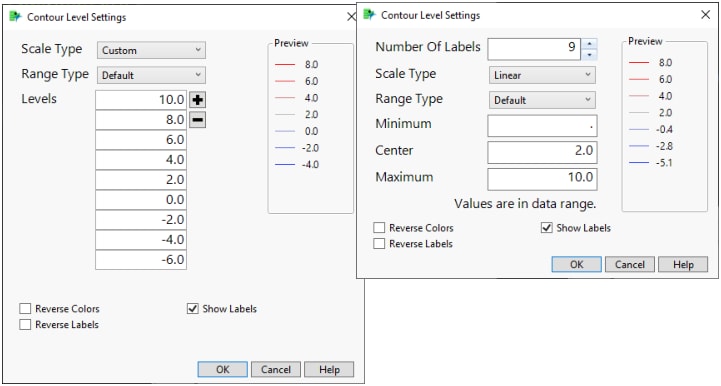
You can specify contour levels either in the Contour Plot launch window (the Specify button) or in the report window from the Contour Plot red triangle menu (the Specify Contours option). Selecting this option displays the Contour Level Settings.
Figure 10.8 Example of Contour Specification: Launch Window (on the left) and Menu (on the right)
You can use the Contour Level Settings to:
• change the number of contours
• specify minimum and maximum values to define the range of the response to be used in the plot
• change the increment between contour values
• change the scale type to Linear, Quantile, Standard Deviation, Log, Log Offset, or Custom (see Scale Type).
Figure 10.9 Contour Level Settings (Scale Type Custom on the left, Linear on the right)
Colors are automatically assigned and are determined by the number of levels in the plot. After the plot appears, you can right-click (press Control and click on macOS) on any contour in the plot legend and choose from the JMP color palette to change that contour color.
Retrieve
This option is both in the Contour Plot launch window (the Retrieve button) and on the Contour Plot red triangle menu (the Retrieve Contours option).
Note: Neither the button nor the menu option are active unless there is an open data table in addition to the table that has the contour plotting values. When you click Retrieve or select Retrieve Contours, a window with a list of open data tables appears.
Using this option, you can retrieve the following from an open JMP data table:
• the number of contours
• an exact value for each level
• a color for each level
From the list of open data tables, select the data table that contains the contour levels.
For level value specification, the Contour Plot platform looks for a numeric column with the same name as the response column that you specified in the Launch window. The number of rows in the data table defines the number of levels.
If there is a row state column with color information, those colors are used for the contour levels. Otherwise, the default platform colors are used.
Revert Contours
This option appears only on the Contour Plot red triangle menu.
If you have specified your own contours, selecting this option reverts your Contour Plot back to the default contours.


