Density Ellipse Report
In the Bivariate platform, use the Density Ellipse option to draw an ellipse (or ellipses) that contains the specified mass of points and to estimate and test the correlation between factors. The number of points contained within the ellipse is determined by the probability value that you select from the Density Ellipse menu.
For more information about the options in the Bivariate Normal Ellipse menu, see Bivariate Fit Options. For an example of this option, see Example of Group By Using Density Ellipses.
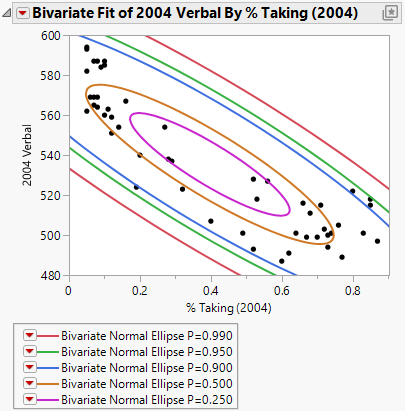
Figure 5.13 Example of Density Ellipses
The density ellipsoid is computed from the bivariate normal distribution fit to the X and Y variables. The bivariate normal density is a function of the means and standard deviations of the X and Y variables and the correlation between them.
The ellipses show where a given percentage of the data is expected to lie, assuming the bivariate normal distribution. The shape of the density ellipsoid is a graphical indicator of the correlation between two variables. A narrow ellipsoid indicates strong correlation while a more circular ellipsoid indicates less correlation between the two variables.
Tip: To see a matrix of ellipses and correlations for many pairs of variables, use the Multivariate platform in the Analyze > Multivariate Methods menu. See “Scatterplot Matrix” in Multivariate Methods.
The Bivariate Normal Ellipse report contains a table of summary statistics for the density ellipse.
Variable
The names of the variables used in creating the ellipse.
Mean
The mean of each variable.
Std Dev
The standard deviation of each variable.
Correlation
The Pearson correlation coefficient. See Statistical Details for the Bivariate Normal Ellipse Report.
Signif. Prob
The probability of obtaining a correlation with greater absolute value than the observed value if no linear relationship exists between the X and Y variables.
Number
The number of observations used in the calculations.
