Enhanced Log in JMP
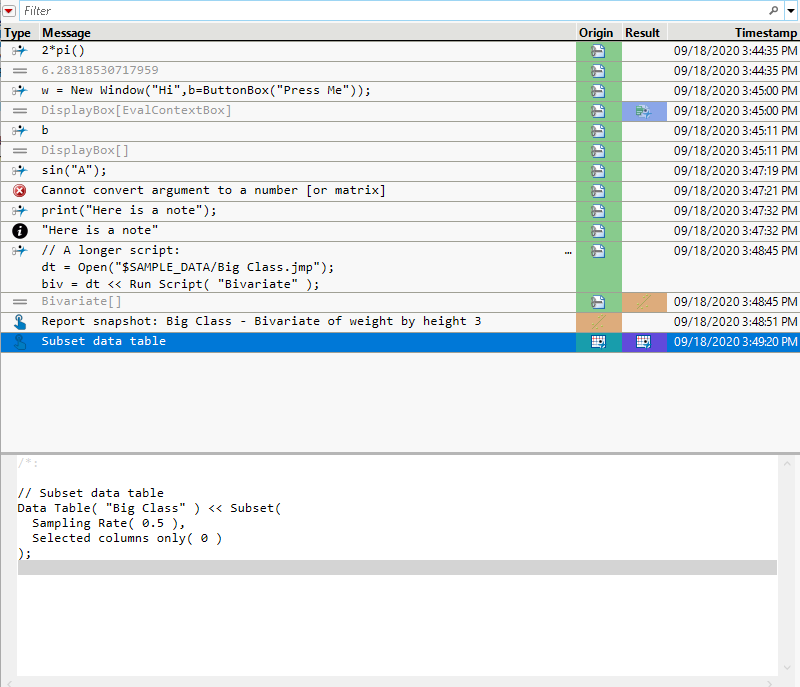
The Enhanced Log is a tabular view of the events in a JMP session. To view the JMP Log, select View > Log (Window > Log on macOS). By default, the log in JMP appears in Enhanced mode. The log window contains events, or actions, in the rows of the table and the corresponding JSL code and output in a separate text pane. This tabular view of the events is easy to navigate, displays errors and warnings, and can help you create a JSL script of the actions in a JMP session. For an example of using the log to generate a JSL script for recorded actions, see Example of Recording Actions in the Enhanced Log. Use the Workflow builder to capture the steps from the Enhanced Log in an easy to use workflow. See “Workflow Builder”.
Note: When you used the embedded log in a script window, the embedded log does not use the Enhanced Log mode. Further, any script output from a script window with an embedded log does not appear in the Enhanced Log.
Figure 4.8 Enhanced Log
Each row of the tabular view contains information in the following columns:
Type
Contains an icon that represents message type. For more information about the types of messages, see Filter.
Tip: You can hover over an icon in the Type column to see the type of message that a particular icon represents.
Message
Contains a description of the event or result. Among other things, this could be a recorded action, JSL that was submitted, the result of JSL that was submitted, or an error message. Each description of a logged item or result is limited to three lines of text; longer items are denoted with an Ellipsis icon ![]() in the upper right corner of the Message section of the row. The full text for longer items appears in the text pane at the bottom of the log window.
in the upper right corner of the Message section of the row. The full text for longer items appears in the text pane at the bottom of the log window.
Origin
Contains an icon that shows the type of JMP window from which the logged item or result was generated. If the Color by Window option is selected in the red triangle menu next to Filter, logged items generated by the same JMP window are specified by a common color. You can click on the icon in the Origin column to bring the corresponding window to the front.
Note: Not all rows in the log table have an icon in the Origin column.
Result
Contains an icon that shows the type of JMP window that contains the result. If the Color by Window option is selected, logged items generated by the same JMP window are specified by a common color. You can click on the icon in the Result column to bring the corresponding window to the front.
Note: Not all rows in the log table have an icon in the Result column.
Timestamp
Contains a date-time value that indicates when the logged item was generated.
Enhanced Log Options
The red triangle menu in the Enhanced Log contains the following options:
Go To
(Available only when one or more rows of the log table are selected.) Brings the window corresponding to the selected row in the log table to the front. If an Origin window and a Result window both appear in the selected row, both windows are brought to the front with the Result window on top of the Origin window.
Run Scripts
(Available only when one or more rows of the log table that contain a scriptable action are selected.) Runs the JSL script that corresponds to the selected rows in the log table.
Color by Window
Specifies whether the rows in the log table are colored by the JMP window that created the row of the log output.
Clear
(Available only when one or more rows of the log table are selected.) Removes the selected row or rows from the log table.
Caution: This action cannot be undone.
Clear Log
Removes all rows from the log table.
Caution: This action cannot be undone.
Filter
Contains the following options to filter what types of logged events appear in the log table.
Result ![]()
Shows or hides rows that correspond to the results of running JSL.
Script ![]()
Shows or hides rows that correspond to submitted JSL.
Log ![]()
Shows or hides rows that correspond to informational log messages.
Warning ![]()
Shows or hides rows that correspond to warning messages in the log.
Error ![]()
Shows or hides rows that correspond to error messages in the log.
Action ![]()
Shows or hides rows in the log table that correspond to interactive JMP actions. These actions include data table operations, platform launches, and closing report windows. You can customize which actions are shown in the log table by selecting specific options in the Action Recording submenu.
Action Recording
Contains the following options to filter what types of interactive JMP actions appear in the log table.
Data Table Operations
Shows or hides rows that correspond to manipulations of a data table. These actions can include row and column operations, as well as actions in the Tables, Rows, and Cols menus.
Platform Launch
Shows or hides rows that correspond to launching a JMP platform.
Report Snapshot on Close
Shows or hides rows that correspond to a JSL script that is saved when a report window is closed.
Save Script
Contains the following options that save a script that reproduces all selected rows in the log table. If no rows are selected, these options save a script to reproduce all events recorded in the log table.
To Script Window
Saves the script to a script window.
To Clipboard
Saves the script to the clipboard.
Make Into Data Table
Creates a data table that contains all rows from the log table. If rows are selected in the log table, they are also selected in the data table that is created.
Filter the Results in the Enhanced Log
To the right of the red triangle menu, use the search field to filter the items in the log table view.
Click the down arrow button next to the search box to refine your search.
Contains Terms
Returns items that contain a part of the search criteria. A search for “ease oom” returns messages such as “Release Zoom”.
Contains Phrase
Returns items that contain the exact search criteria. A search for “text box” returns entries that contain “text” followed directly by “box” (for example, “Context Box” and “Text Box”).
Starts With Phrase
Returns items that start with the search criteria.
Ends With Phrase
Returns items that end with the search criteria.
Whole Phrase
Returns items that consist of the entire string. A search for “text box” returns entries that contain only “text box”.
Regular Expression
Enables you to use the wildcard (*) and period (.) in the search box. Searching for “get.*name” looks for items that contain “get” followed by one or more words. It returns “Get Color Theme Names”, “Get Name Info”, and “Get Effect Names”, and so on.
Invert Result
Returns items that do not match the search criteria.
Match All Terms
Returns items that contain both strings. A search for “t test” returns elements that contain either or both of the search strings: “Pat Test”, “Shortest Edit Script” and “Paired t test”.
Ignore Case
Ignores the case in the search criteria.
Match Whole Words
Returns items that contain each word in the string based on the Match All Terms setting. If you search for “data filter”, and Match All Terms is selected, entries that contain both “data” and “filter” are returned.
Example of Recording Actions in the Enhanced Log
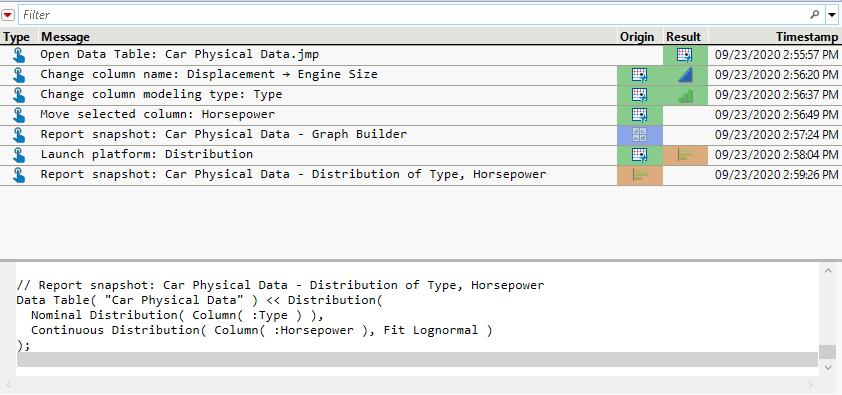
You can use the Enhanced Log to record many of the interactive actions that you perform for data cleanup and analysis. In this example, the Enhanced Log is used to generate a JSL script for some data manipulation and analysis actions.
1. Select View > Log.
2. Click the red triangle next to the Filter box and select Clear Log.
3. Select Help > Sample Data Folder and open Car Physical Data.jmp.
4. Right-click Displacement in the Columns panel in the data table, and select Column Info.
5. Type Engine Size for the Column Name. Click OK.
6. Right-click Type in the Columns panel in the data table, and select Column Info.
7. Select Ordinal for the Modeling Type. Click OK.
8. Click Horsepower in the Columns panel in the data table and drag it above Weight.
9. Select Graph > Graph Builder.
10. Drag Horsepower to the Y drop zone.
11. Drag Engine Size to the X drop zone.
12. Close the Graph Builder window.
13. Select Analyze > Distribution.
14. Select Type and Horsepower and click Y, Columns.
15. Click OK.
16. Click the red triangle next to Horsepower and select Continuous Fit > Fit Lognormal.
17. Close the Distribution window.
18. Select View > Log.
Figure 4.9 Enhanced Log
19. Press Ctrl and select the first, second, third, and last rows of the log table.
20. Click the red triangle next to the Filter box and select Save Script > To Script Window.
The script to reproduce the selected actions appears in a new script window. You can save this script to reuse later or use it as a starting point for a more complex analysis.

