Example of Analyzing Left-Censored Data
You can analyze left-censored data using the Nonlinear platform. For the left-censored data in this example, zero is the censored value because it also represents the smallest known time for an observation.
Note: The Tobit model is popular in economics for responses that must be positive or zero, with zero representing a censored point. It assumes a normal distribution that is censored at zero. An observation of zero is considered to be left-censored.
Note the following about the Tobit2.jmp data table:
• The response variable is a measure of the durability of a product and cannot be less than zero (Durable, is left-censored at zero).
• Age and Liquidity are independent variables.
• The table also includes the model and Tobit loss function. The model in residual form is durable-(b0+b1*age+b2*liquidity).
Tip: To see the formula associated with Tobit Loss, right-click the column and select Formula.
1. Select Help > Sample Data Folder and open Reliability/Tobit2.jmp.
2. Select Analyze > Specialized Modeling > Nonlinear.
3. Select Model and click X, Predictor Formula.
4. Select Tobit Loss and click Loss.
5. Click OK.
6. Click Go.
7. Click Confidence Limits.
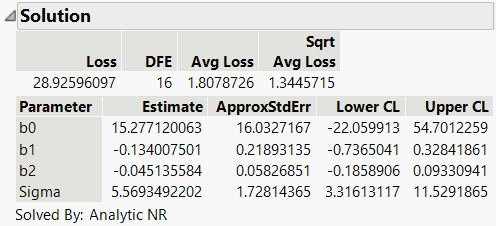
The parameter estimates with confidence limits are shown in Figure 15.23.
Figure 15.23 Solution Report
