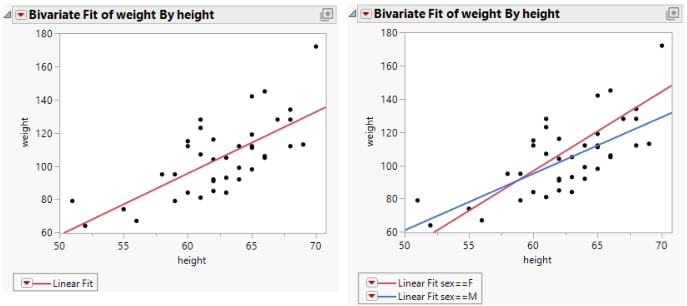
Example of Group By Using Regression Lines
This example shows you how to use a grouping variable in the Bivariate platform to overlay regression lines so that you can compare the slopes of different groups.
1. Select Help > Sample Data Folder and open Big Class.jmp.
2. Select Analyze > Fit Y by X.
3. Select weight and click Y, Response.
4. Select height and click X, Factor.
5. Click OK.
To create the example on the left in Figure 5.20:
6. Click the Bivariate Fit red triangle and select Fit Line.
To create the example on the right in Figure 5.20:
7. From the Linear Fit menu, select Remove Fit.
8. Click the Bivariate Fit red triangle and select Group By.
9. From the list, select sex.
10. Click OK.
11. Click the Bivariate Fit red triangle and select Fit Line.
Figure 5.20 Example of Regression Analysis for Whole Sample and Grouped Sample
The scatterplot on the left in Figure 5.20 has a single regression line that relates weight to height. The scatterplot on the right shows separate regression lines for males and females.
