Example of Inverse Prediction for Multiple Predictors
Use the Standard Least Squares personality of the Fit Model platform to fit a linear regression model and then obtain predictions of the input based on specified response levels. This is known as an inverse prediction. This example considers inverse prediction for multiple predictors. For a single predictor, see Example of Inverse Prediction. Follow this example to predict the Runtime that results in oxygen uptake of 50 when RstPulse is 60 for both males and females.
1. Select Help > Sample Data Folder and open Fitness.jmp.
2. Select Analyze > Fit Model.
3. Select Oxy and click Y.
4. Select Sex, Runtime, and RstPulse and then select Add.
5. Click Run.
6. Click the Response Oxy red triangle and select Estimates > Inverse Prediction.
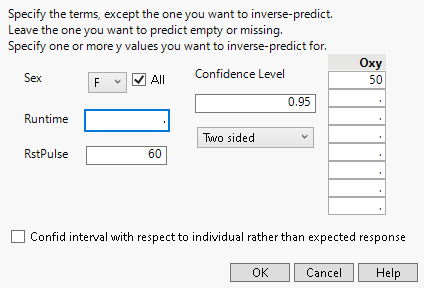
7. Delete the value for Runtime, because you want to predict that value.
8. Select the All box next to Sex to estimate Runtime for all levels of Sex.
9. Replace the mean for RstPulse with 60.
10. Enter the value 50 for Oxy.
Figure 4.53 Inverse Prediction Specification
11. Click OK.
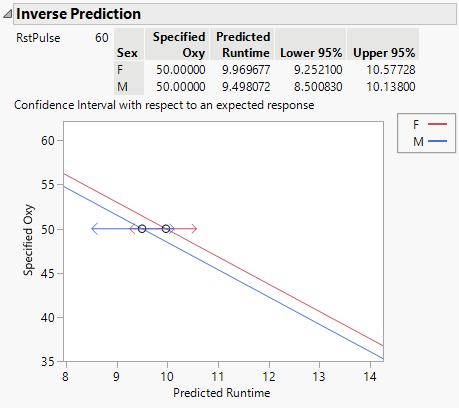
Figure 4.54 Inverse Prediction Report for a Multiple Regression Model
The Inverse Prediction report contains the predicted values of Runtime for both females and males. The plot shows the linear fits for females and males, given that RstPulse is 60. The 95% confidence intervals for females and males are shown in red and blue, respectively.

