Example of Mediation Analysis
This example demonstrates how to perform mediation analysis in the Structural Equation Models platform. The data consist of educational variables to investigate the racial climate among secondary school students from diverse backgrounds. The goal in this example is to explore the role of autonomy in mediating how feelings of belonging in school affect interest in school for secondary students.
1. Select Help > Sample Data Folder and open Secondary Students.jmp.
2. Select Analyze > Multivariate Methods > Structural Equation Models.
3. Select Interest, Belonging, and Autonomy and click Model Variables.
4. Click OK.
5. Click the Model Shortcuts red triangle and select Cross-Sectional Classics > Mediation Analysis.
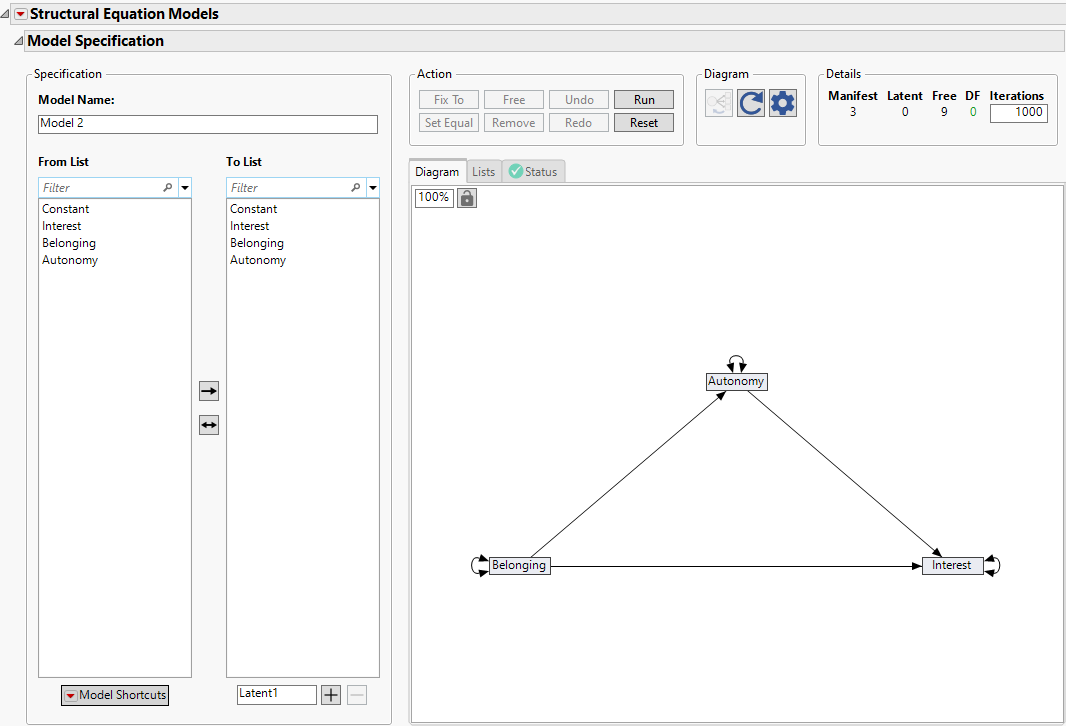
6. In the Specify Mediation Model window, select Belonging, Autonomy, and Interest for the Causal Variable, Mediator Variable, and Outcome Variable options, respectively.
7. Click OK.
Figure 8.17 Structural Equation Models Specification
8. Click Run.
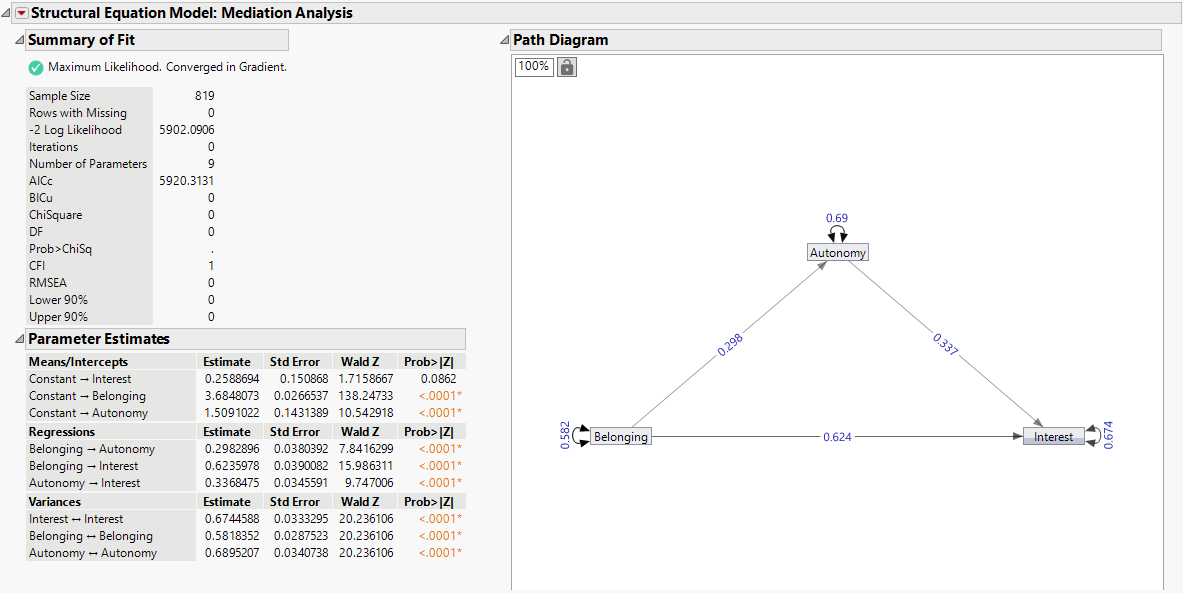
Figure 8.18 Structural Equation Models Report
The report that appears includes Summary of Fit and Parameter Estimates tables for the mediation analysis model. The model emphasizes direct effects between dependent and independent variables. The Parameter Estimates table contains the estimated mean and intercept values for each variable, estimates of the regression coefficients between the predictor variables (Belonging and Autonomy) and the outcome variables (Interest and Autonomy), and the estimated variances and residual variances. The report shows that the effects that are represented by these estimates are statistically significant. You can make the following conclusions based on these estimates:
– Belonging ⇒ Autonomy path: two students that differ by one unit on Belonging are estimated to differ by 0.298 units on Autonomy. The positive sign of the coefficient suggests that as Belonging goes up, Autonomy is likely to go up too.
– Autonomy ⇒ Interest path: two students equal on Belonging scores but who differ by one unit in their Autonomy are estimated to differ by 0.337 units on Interest. The positive sign of the coefficient suggests that having more Autonomy is related to having more Interest.
– Belonging ⇒ Interest path: two students that differ by one unit on Belonging and do not differ on Autonomy are estimated to differ by 0.624 units on Interest. The direct effect shows a positive value, which means that as Belonging increases, Interest will probably increase as well.
Next, you want to calculate the total and indirect effects.
1. Click the red triangle next to Structural Equation Model: Mediation Analysis and select the Total Effects option.
2. Click the red triangle next to Structural Equation Model: Mediation Analysis and select the Indirect Effects option.
Figure 8.19 Total and Indirect Effects
The Total Effects table contains the total effects between predictors (Belonging and Autonomy) and the outcome variables (Interest and Autonomy). The total effects are the combined direct and indirect influence of the predictor variables on the outcome variable. In this example, there are only direct effects from Belonging to Autonomy and from Autonomy to Interest, which is why those total effects are identical to the direct effects in the Parameter Estimates table. This table shows that Belonging has a strong and positive total effect (0.724) on Interest. The significant effect indicates a meaningful contribution of Belonging to Interest. Total effects quantify the average change in the outcome variable associated with a one unit change in the predictor variable while holding other variables constant. For example, every one unit increase in Belonging is associated with an estimated 0.724 unit increase in Interest.
The Indirect Effects table contains the indirect effect estimate, which emphasizes the effect of Belonging on Interest that goes through Autonomy. This table shows that the estimated indirect effect (0.100) of Belonging on Interest through the mediating variable Autonomy is statistically significant, which suggests that changes in Belonging have an impact on Interest through changes in the mediator Autonomy.
You can conclude that for two students that differ by one unit in their Belonging, they are estimated to differ by 0.100 units on Interest as a result of the tendency for those with higher Belonging to have higher Autonomy which in fact translates into greater Interest.
In mediation analysis, one of the challenges is estimating the indirect effect. The distribution of this estimate tends to be nonnormal, especially in smaller sample sizes. The bootstrap method offers a solution to this challenge. Bootstrapping involves repeatedly resampling with replacement from the observed data set to empirically estimate the sampling distribution of the indirect effect. This approach provides more accurate standard errors and confidence intervals for the indirect effect.
Use the following steps to obtain the bootstrap confidence intervals for parameter estimates, and Total and Indirect effects:
1. Right-click the Estimate column in the table of interest and select Bootstrap.
2. Type 1000 for the Number of Bootstrap Samples.
3. (Optional) To match the results in Figure 8.20, type 1234 for the Random Seed.
4. Click OK.
5. In the Bootstrap Results table, run the Distribution script.
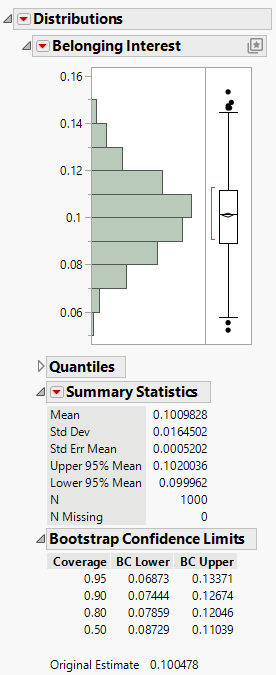
Figure 8.20 Bootstrap Report
The report that appears contains information about the distributions of the bootstrap estimates. The Summary of Statistics table indicates that the bootstrap estimate of the indirect effect is 0.101. This estimate is almost the same as the estimated indirect effect shown in Figure 8.19. The Bootstrapping Confidence Limits report contains bias-corrected confidence limits for the estimated indirect effect. The 95% confidence interval does not include zero, which indicates significance of the indirect effect in the mediation analysis.
Tip: You can use the Inference > Bootstrap Inference option in the Structural Equation Models red triangle menu to obtain bootstrap estimates for the full model.


