Example of MSA Design
In this example, you use an MSA design to study the variability in your measurement systems due to instruments and operators. You have three laboratories, each with a gauge. Each laboratory has two operators who have time to participate in the study. Each laboratory has a set of five standard parts to weigh, and each operator makes six measurements per part per gauge.
1. Select DOE > Special Purpose > MSA Design.
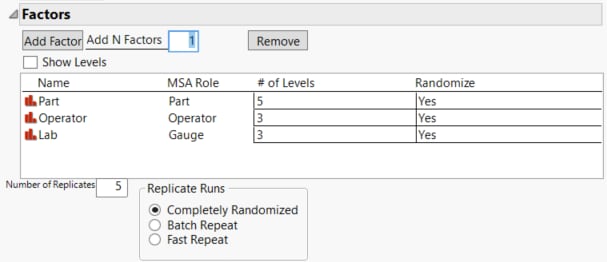
2. Set Add N Factors to 3 and click Add Factor.
3. Rename X1 to Part, click on None to set the MSA Role to Part, and type 5 in the # of Levels column.
4. Rename X2 to Operator, click on None to set the MSA Role to Operator, and type 3 in the # of Levels column.
5. Rename X3 to Lab, click on None to set the MSA Role to Gauge, and type 3 in the # of Levels column.
6. In the Number of Replicates box, type 5.
Specifying 5 replicates indicates that each run of the design contains 6 measurements.
7. Leave the Replicate Runs set to Completely Randomized.
Figure 25.2 Factor Settings
8. Select Show Levels (check box in the Factors section).
9. Edit the factor Values as shown in Figure 25.3.
Figure 25.3 Factor Values
Note: Setting the Random Seed in step 10 reproduces the design and diagnostics shown in this example.
10. (Optional) Click the MSA red triangle, select Set Random Seed, and type 123.
11. Click OK.
MSA Design Structure
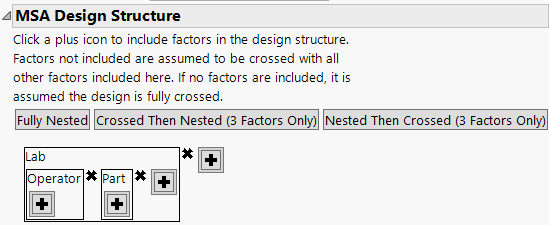
If you click Make Design without specifying a design structure, a fully crossed model is used. In this example, you specify a design where operator and part are nested within lab as operators work at a single laboratory and the parts are unique to each laboratory. To specify a nested design or nested and crossed design use the plus button to enter terms into your model.
12. Click the plus button and select Lab.
13. In the Lab box, click the plus button and select Operator.
14. In the Lab box, click the plus button and select Part.
These steps create a model that crosses Part with Operator, nested within Lab.
Figure 25.4 MSA Design Structure
15. Click Make Design.
Note: Click Make Table to generate a table for data collection. See MSA Design Table for analysis scripts that are included in the design table.
16. Scroll down to the Design Diagnostics section and click the gray disclosure icon to open the report.
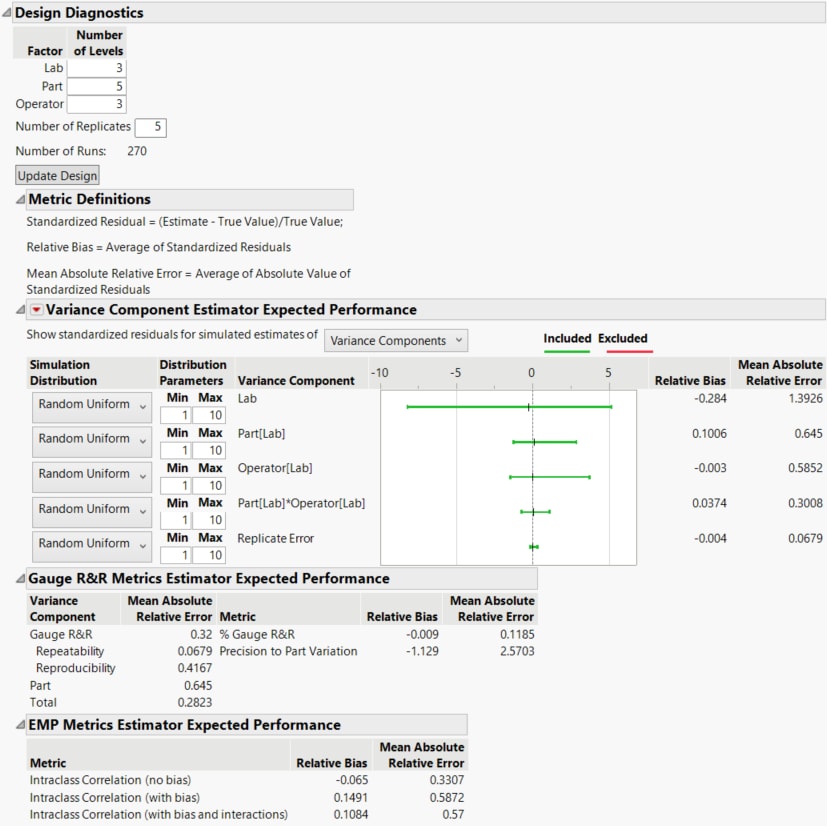
The Design Diagnostics report contains estimated Gauge R&R and EMP results based on a simulation of 1000 trials. These estimates are used to evaluate the strength of your MSA study design.
17. Click the Variance Component Estimator Performance gray disclosure icon to open the report.
Figure 25.5 MSA Design Diagnostics
All diagnostics are based on simulations. See Statistical Details for the MSA Design Platform. Adjust the simulation settings for each factor to explore the impact on your design diagnostics. Ideally, one would like the mean absolute relative error (MARE) estimates to be less than one. The MARE for the lab variance component is greater than one. It is not possible to add an additional lab to your experiment. However, you could add more operators. Explore the impact of adding an additional operator at each lab for a total of 6 operators.
18. In the Design Diagnostics section, increase the number of operators to six. The MARE estimates are automatically updated. Now the MARE estimate for Lab is 1.07 and all other MAREs are less than one.
19. Open the Design section.
20. Click the Update Design button to update your design to include six operators. Review the design in the Design section to see the update.
21. Click Make Table to make a design table for data collection.
Note: The diagnostics are based on a completely randomized design. The logistics of running the MSA might require the replicates to be run sequentially.


