Example of the Fit Curve Platform
This example shows how to build a model for toxicity as a function of the concentration of a drug. You have a standard formulation of the drug and want to compare it to three new formulations.
You are interested in a toxicity ratio of non-surviving to surviving cells at a specific concentration of each drug. From prior research, you know the toxicity ratios for 16 different concentrations of each drug formulation. A higher ratio indicates more toxicity, which could be detrimental to development of the drug. Log concentration was calculated to decrease the range of concentration values and make it easier to detect differences in the curves.
1. Select Help > Sample Data Folder and open Nonlinear Examples/Bioassay.jmp.
2. Select Analyze > Specialized Modeling > Fit Curve.
3. Assign Toxicity to the Y, Response role.
4. Assign log Conc to the X, Regressor role.
5. Assign Formulation to the Group role.
6. Click OK.
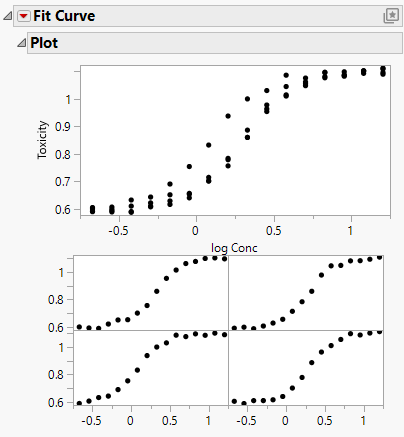
Figure 14.2 Initial Fit Curve Report
The Plot report contains an overlaid plot of the fitted model of each formulation.
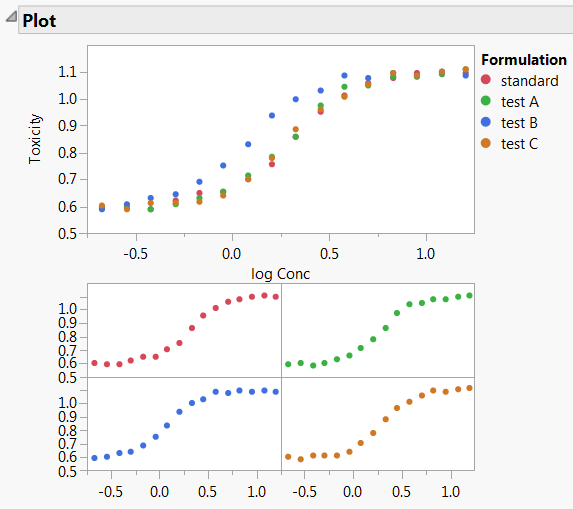
7. To see a legend identifying each drug formulation, right-click one of the graphs and select Row Legend. Select Formulation for the column and click OK.
Figure 14.3 Fit Curve Report with Plot Legend
The curves appear S-shaped, so a sigmoid curve would be an appropriate fit. Table 14.1 shows formulas and graphical depictions of the different types of models that the Fit Curve platform offers.
8. Click the Fit Curve red triangle and select Sigmoid Curves > Logistic Curves > Fit Logistic 4P.
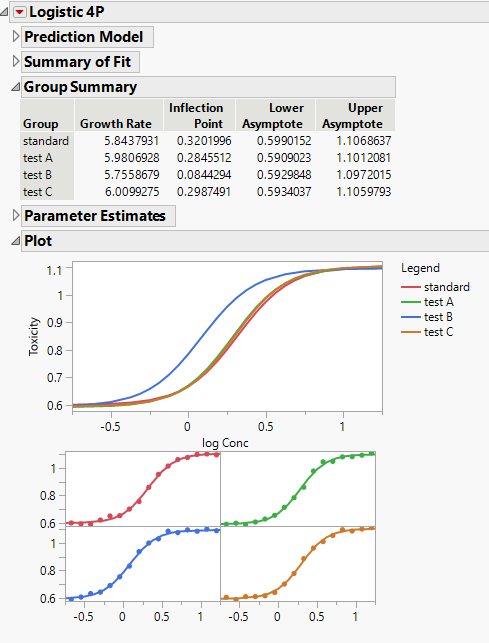
Figure 14.4 Logistic 4P Report
The Logistic 4P report appears. There is also a separate plot for each drug formulation. The plot of the fitted curves suggests that formulation B might be different, because the test B curve starts to rise sooner than the others. Inflection point parameters cause this rise.
9. Click the Logistic 4P red triangle and select Compare Parameter Estimates.
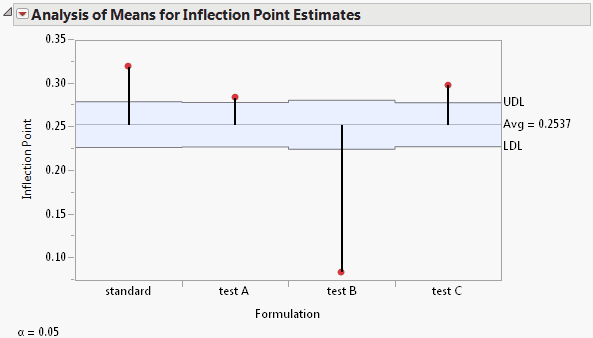
Figure 14.5 Parameter Comparison Report
Notice that the Inflection Point parameter for the test B formulation is significantly lower than the average inflection point. This agrees with the plots shown in Figure 14.4. Drug formulation B has a higher toxicity ratio than the other formulations.


