Publication date: 02/06/2025
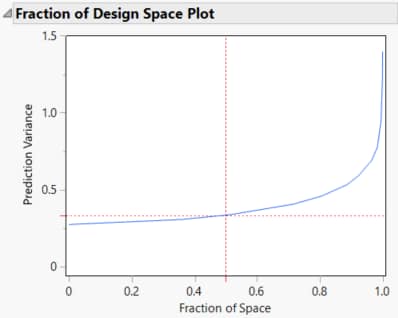
Fraction of Design Space Plot
In the Evaluate Design report, the Fraction of Design Space Plot shows relative prediction variance as a function of the proportion of the design space. It is desirable to have a large proportion of the design space with low prediction variance values. Red dotted crosshairs mark the value that bounds the relative prediction variance for 50% of design space.
Figure 16.10 Fraction of Design Space Plot
Note: Random sampling of the design space is used in constructing the Fraction of Design Space Plot. Therefore, repeated plots for the same design might vary slightly.
Want more information? Have questions? Get answers in the JMP User Community (community.jmp.com).
