Iterative Clustering Report
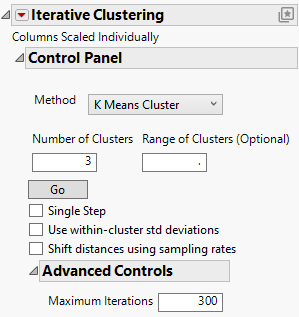
In the K Means Cluster platform, the Iterative Clustering report shows a Control Panel for fitting models. You can iteratively fit different numbers of clusters or you can specify a range using the Range of Clusters option. As you fit models, additional reports are added to the window. See K Means Report.
Figure 14.7 Iterative Clustering Control Panel
The Control Panel has the following options:
Method
The following clustering methods are available:
KMeans Clustering
Described in this chapter.
Self Organizing Map
Described in Self Organizing Map Control Panel.
Number of Clusters
Designates the number of clusters to form.
Range of Clusters (Optional)
Provides an upper bound for the number of clusters to form. If a number is entered here, the platform creates separate analyses for every integer between Number of Clusters and the value entered as Range of Clusters (Optional).
Go
Unless Single Step is selected, fits the clusters automatically.
Single Step
Enables you to step through the clustering process one iteration at a time. When you select Single Step and click Go, a K Means Cluster report appears with no cluster assignments but containing a Go and a Step button.
– Click the Step button to step through the iterations one at a time.
– Click the Go button to fit the clusters automatically.
Use within-cluster std deviations
Scales distances using the estimated standard deviation of each variable for observations within each cluster. If you do not select this option, distances are scaled by an overall estimate of the standard deviation of each variable.
Shift distances using sampling rates
Adjusts distances based on the sizes of clusters. If you have unequally sized clusters, an observation should have a higher probability of being assigned to larger clusters because there is a higher prior probability that the observation comes from a larger cluster.
Advanced Controls
The following advanced controls are available:
Maximum Iterations
The maximum number of iterations of the convergence stage of the EM algorithm.
Iterative Clustering Options
This section covers the options in the Iterative Clustering red triangle menu.
See “Local Data Filters in JMP Reports”, “Redo Menus in JMP Reports”, “Save Platform Preferences”, and “Save Script Menus in JMP Reports” in Using JMP for more information about the following options:
Local Data Filter
Shows or hides the local data filter that enables you to filter the data used in a specific report.
Redo
Contains options that enable you to repeat or relaunch the analysis. In platforms that support the feature, the Automatic Recalc option immediately reflects the changes that you make to the data table in the corresponding report window.
Platform Preferences
Contains options that enable you to view the current platform preferences or update the platform preferences to match the settings in the current JMP report.
Save Script
Contains options that enable you to save a script that reproduces the report to several destinations.
Save By-Group Script
Contains options that enable you to save a script that reproduces the platform report for all levels of a By variable to several destinations. Available only when a By variable is specified in the launch window.
Note: Additional options for this platform are available through scripting. Open the Scripting Index under the Help menu. In the Scripting Index, you can also find examples for scripting the options that are described in this section.
