Launch the Pareto Plot Platform
Launch the Pareto Plot platform by selecting Analyze > Quality and Process > Pareto Plot.
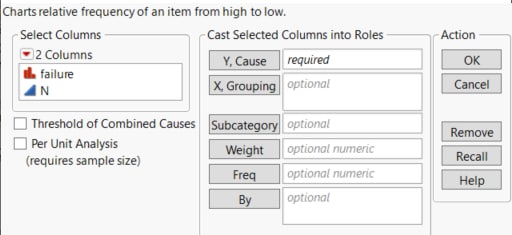
Figure 15.5 The Pareto Plot Launch Window
For more information about the options in the Select Columns red triangle menu, see “Column Filter Menu” in Using JMP.
The Pareto Plot launch window contains the following options:
Y, Cause
Identifies the column whose values are the cause of a problem. It is called the process variable and is the variable that you want to inspect.
X, Grouping
Identifies the grouping factor. The grouping variable produces one Pareto plot window with side-by-side plots for each value. You can have no grouping variable, one grouping variable (see Example of a One-Way Comparative Pareto Plot), or two grouping variables (see Example of a Two-Way Comparative Pareto Plot).
Subcategory
Assigns a variable that splits the causes into subcategories. The subcategories for each cause are shown as different colored bars on the Pareto plot.
Weight
Assigns a variable to give the observations different weights.
Freq
Identifies the column whose values hold the frequencies.
By
Identifies a variable to produce a separate analysis for each value that appears in the column.
Threshold of Combined Causes
Enables you to specify a threshold for combining causes by specifying a minimum rate or count. Select the option and then select Tail % or Count and enter the threshold value. The Tail percent option combines smaller count groups against the percentage specified of the total (combined small groups count/total group count). The Count option enables you to specify a specific count threshold. For an example, see Example of a Threshold for Combined Causes.
Per Unit Analysis
Enables you to compare defect rates across groups. JMP calculates the defect rate as well as 95% confidence intervals of the defect rate. Select the option and then select Constant or Value in Freq Column and enter the sample size value or cause code, respectively. The Constant option enables you to specify a constant sample size on the launch window. The Value In Freq Column option enables you to specify a unique sample size for a group through a special cause code to designate the rows as cause rows.
Although causes are allowed to be combined in Pareto plots, the calculations for these analyses do not change correspondingly.
For examples, see Example of a Constant Sample Size across Groups and Example of a Non-Constant Sample Size across Groups.
