Launch Windows in JMP Platforms
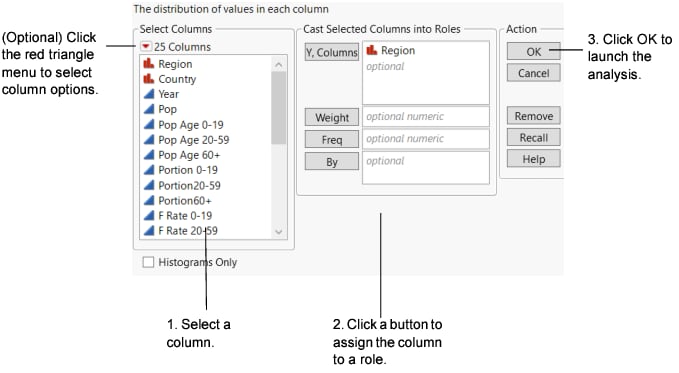
The launch window is your point of entry into a platform, where you specify the columns to analyze. Figure 2.11 shows the Distribution launch window.
Figure 2.11 Launch Window Features
All launch windows have in common provide the following options:
Select Columns
Lists all of the variables in your current data table. Note the following:
– Right-click the modeling type icon next to a column name to change the modeling type.
– Right-click the column name to create a transform column. See “Transform Columns in a JMP Platform”.
– Filter and sort the columns using the options in the red triangle menu. See Column Filter Menu.
Cast Selected Columns into Roles
Moves selected columns into roles (such as Y, X, and so on.) You cast a column into the role of a variable (like an actor is cast into a role). See Cast Selected Columns into Roles Buttons.
In the Graph Builder window, click the Dialog button on the left or select Redo > Relaunch Analysis to show this panel.
Action
The following options are available:
OK
Performs the analysis.
Cancel
Stops the analysis and quits the launch window.
Remove
Deletes any selected variables from a role.
Recall
Populates the launch window with the last analysis that you performed.
Help
Takes you to the Help for the launch window.
Tip: To reopen the platform launch window that was last opened, select View > Recall Last Platform (Windows) or Window > Recall Last Platform (macOS).
Cast Selected Columns into Roles Buttons
The following buttons frequently appear throughout launch windows. Buttons that are specific to certain platforms are described in the chapter for the specific platform.
Y
Identifies a column as a response or dependent variable whose distribution is to be studied.
X
Identifies a column as an independent, classification, or explanatory variable that predicts the distribution of the Y variable.
Weight
Identifies the data table column whose variables assign weight (such as importance or influence) to the data.
Freq
Identifies the data table column whose values assign a frequency to each row. This option is useful when a frequency is assigned to each row in summarized data. If the value is 0 or a positive integer, then the value represents the frequencies or counts of observations for each row when there are multiple units recorded.
 Validation
Identifies the data table column whose values assign rows to training, validation, and test sets for cross validation in fitting models.
Notes:
– For some platforms, KFold validation is available if you specify more than three levels in the Validation column.
– If you click the Validation button with no columns selected in the Select Columns list, you have the option to create a Validation column. For more information about the Make Validation Column utility, see “Make Validation Column” in Predictive and Specialized Modeling.
By
Identifies a column that creates a report consisting of separate analyses for each level of the variable.
Column Filter Menu
A Column Filter menu appears in most of the launch windows. The Column Filter menu is found by clicking the red triangle in the Select Columns panel. Use these options to sort columns, show or hide columns, or search columns.
Figure 2.12 The Column Filter Menu
Reset
Resets the columns to its original list.
Show Filter
Opens a box in which you type the column name that you want to find. Click the arrow next to the box and select options to customize the filter.
Sort by Name
Sorts the columns in alphabetical order by name in ascending, descending, or original order.
Modeling Type
Provides options for showing or hiding columns with specific modeling types.
Numeric
Shows or hides columns whose data type is Numeric.
Character
Shows or hides columns whose data type is Character.
Expression
Shows or hides columns whose data type is Expression.
Exclude Formats
Excludes columns with specific formats from the column selection list.
Column Groups
Shows or hides groups of columns. See “Group Columns in Data Tables”.
Ungrouped Columns
Shows or hides columns that have not been grouped.

