Launch the Process Screening Platform
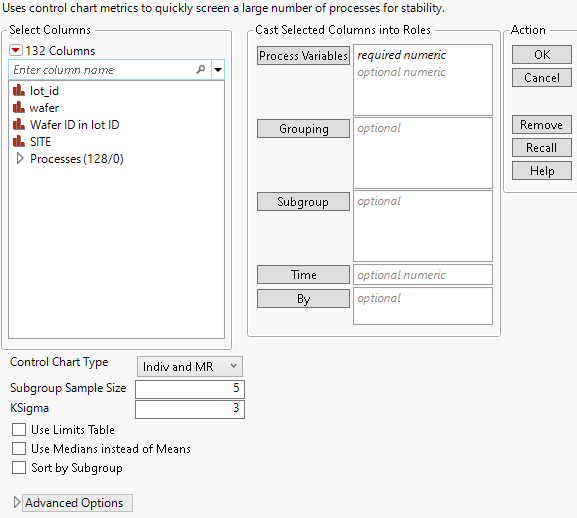
Launch the Process Screening platform by selecting Analyze > Quality and Process > Process Screening.
Figure 8.5 Process Screening Launch Window
For more information about the options in the Select Columns red triangle menu, see “Column Filter Menu” in Using JMP.
Launch Window Roles
Process Variables
The columns of process data containing the measurements to be analyzed. The columns must have a Numeric data type. If a process variable has a Control Limits column property, the Process Screening platform uses those limits to calculate the Specified Sigma.
Note: The platform does not support control limits that are specified in a Control Limits column property for dispersion charts.
Grouping
Columns assigned as grouping variables. Each process variable is analyzed at each combination of levels of the grouping variables. The results are presented in a single report.
Subgroup
Assigns one or more subgroup variables. If more than one subgroup variable is assigned, the subgroup levels are defined as a combination of the multiple columns.
Note: The Subgroup role is ignored for Indiv and MR charts.
Time
A numeric column whose values are used for the time order for the data. Use the Time role for data that are time-stamped. The time stamp is used for the time axis in quick graphs and shift graphs. The process data are sorted by the Time variable before calculations are performed.
By
A column whose levels define separate analyses. For each level of the specified column, the corresponding rows are analyzed using the other variables that you have specified. The results are presented in separate tables and reports. If more than one By variable is assigned, a separate analysis is produced for each possible combination of the levels of the By variables.
Launch Window Options
Control Chart Type
Select one of five control chart types: Indiv and MR (Individual Measurement and Moving Range); XBar and R; XBar and S; XBar, MR, and R; or XBar, MR, and S. The XBar, MR, and R control chart and the XBar, MR, and S control chart are also referred to as three way control charts. For more information about statistical details, see “Statistical Details for Control Chart Builder”.
Note: If the subgroup size for a process is 1, the chart automatically switches to an Indiv and MR chart.
Subgroup Sample Size
Specifies a constant sample size for subgroups. The minimum subgroup size is 2. A subgroup size of 5 is the default. The Subgroup Sample Size specification is ignored for Indiv and MR charts or when a subgroup variable is specified.
KSigma
Specifies the sigma multiplier. KSigma is the value that is multiplied by sigma in the calculation of control limits. By default, KSigma is 3.
Use Limits Table
Enables you to import historical control limits and specification limits from a data table. When you select this option and click OK in the launch window, a Choose limits table window appears. Once you choose a limits table and click OK, a Limits Specification window appears. Assign columns in your limits table to appropriate roles and click OK. See Limits Table.
Note: If you do not select this option, limits and sigma values are obtained from the Control Limit, Spec Limit, or Process Screening column properties for the Process Variables. If you do not select this option and the Process Variables do not have control limit column properties, the control limits are calculated from the data.
Tip: To add columns properties to several columns at once, see “Manage Limits”
Use Medians instead of Means
Estimates the center line using the median of the observations. Sigma is estimated using scaling factors obtained using Monte Carlo simulation. The table of factors is given in Statistical Details for the Process Screening Platform. The calculation depends on the type of chart selected:
– For XBar and R chart or Indiv and MR chart calculations, sigma is estimated using the scaled median of the ranges.
– For XBar and S chart calculations, sigma is estimated using the scaled median of the standard deviations.
– For unequal subgroup sizes, the scaling factor corresponds to the average subgroup size rounded to the nearest integer.
When one or more outliers influence the location of the center line, many subgroups can appear out of control. Using the median alleviates this problem.
Note: When Use Medians instead of Means is selected, the results obtained from the Control Charts for Selected Items or the Process Capability for Selected Items red triangle menu options do not match the Process Screening results.
Sort by Subgroup
Sorts the process data by the subgroup variable, or combination of nested subgroup variables, before calculations are performed.
Advanced Options
Contains the following options:
Shift Threshold
Specify a value that controls the sensitivity of the Shift Graph. Shift Threshold is set to three by default. After outlier removal, the Shift Graph shows a plot of the time occurrence of all process shifts that exceed the number of within-sigma units specified by the Shift Threshold. See Shift Graph.
Outlier Threshold
Specify a value that controls the sensitivity of outlier removal for detection of large recent shifts and for the Shift Graph. Outlier Threshold is set to five by default. If the number of within sigma units from an observation to both of its neighboring observations exceeds the specified Outlier Threshold, that observation is replaced with a value that is one within-sigma unit away from its closest neighboring observation. See Shift Magnitudes and Positions.
Shift Lambda
Enables you to change the exponentially weighted moving average (EWMA) weight used in the Shift Graph. See Shift Magnitudes and Positions.
Drift Beta
The weight used in the exponentially weighted moving average (EWMA) for drift detection. Drift Beta is set to 0.05 by default.
Minimum Process Length
The minimum number of data values that a process must have in order to be included in the analysis. By default, this value is set to 3.
