Launch Windows for Specific Control Charts
The options that appear in the launch windows for specific control charts vary depending on whether you are launching variable control charts or attribute control charts. You can access these launch windows through the Analyze > Quality and Process > Control Chart menu. These launch windows enable you to specify variables for a control chart in Control Chart Builder.
Launch Windows for Variable Control Charts
This section contains information about the launch windows for IMR, XBar, Run, Levey Jennings, IMR on Means, and Three Way Control Charts.
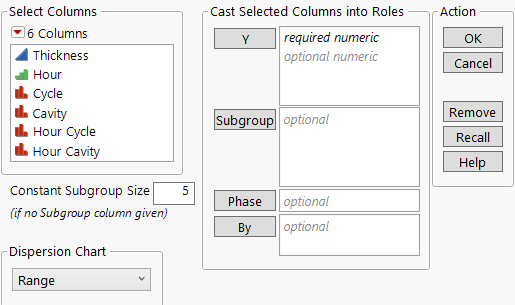
Figure 3.5 Launch Window for Variable Control Charts
For more information about the options in the Select Columns red triangle menu, see “Column Filter Menu” in Using JMP.
Y
Assigns the process variables.
Subgroup
(Not available for Run charts.) Assigns the subgroup variables. When a subgroup variable is assigned, each point on the control chart corresponds to a summary statistic for all of the points in the subgroup.
Product/Part
(Available only for Short Run charts.) Assigns the Product/Part variable. When a Part variable is assigned, statistics are calculated for each product, or level of the Part variable. These statistics are used to calculate the control limits.
Label
(Not available for XBar, IMR on Means, or Three Way Control Charts.) Assigns a sample label variable to uniquely label individual measurements. The labels are not sorted and appear on the horizontal axis in the same order they appear in the data table.
Note: If a subgroup size greater than one is specified by a Subgroup variable, a constant subgroup size, or the Set Subgroup Size command in a script, the Label variable is ignored.
Phase
(Not available for Run charts.) Assigns the phase variable. When a Phase variable is assigned, separate control limits are computed for each phase.
Note: If there is a spec limits column property, by default, the same specification limits are used for each phase. However, no capability analysis is shown.
By
Identifies a variable to produce a separate analysis for each value that appears in the column.
Sort by Subgroup
(Available only for IMR charts.) Sorts all Y variables by the Subgroup variable.
Show Center Line
(Available only for Run charts.) Shows the center line on the chart.
Constant Subgroup Size
(Available only for XBar and Three Way charts.) Specifies a number of observations that make up each subgroup. If the number of observations per subgroup is not constant, you should specify a column in the Subgroup role.
Note: If you specify a Subgroup variable, the platform ignores the setting for the Constant Subgroup Size option.
Dispersion Chart
(Available only for XBar charts.) Specifies the type of dispersion chart that appears below the XBar chart. You can choose between no dispersion chart, a range chart (XBar & R), or a standard deviation chart (XBar & S).
Grouping Method
(Available only for Three Way charts.) Specifies the statistic represented by the points on the first chart. The options are Mean and Standard Deviation. See Statistic.
Between Chart
(Available only for Three Way charts.) Specifies the method for computing the between sigma estimate. The options are Moving Range and Median Moving Range. See Sigma and Statistical Details for Three Way Control Charts.
Within Chart
(Available only for Three Way charts.) Specifies the method for computing the within sigma estimate. The options are Range and Standard Deviation. See Sigma and Statistical Details for Three Way Control Charts.
Scaling Method
(Available only for Short Run charts.) Specifies the scaling method for the control chart. The options are Centered and Standardized.
Launch Windows for Attribute Control Charts
This section contains information about the launch windows for P, NP, C, U, Laney P′, and Laney U′ Control Charts.
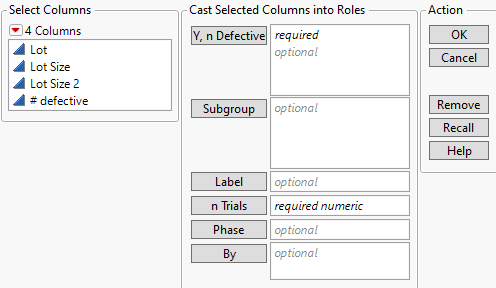
Figure 3.6 Launch Window for Attribute Control Charts
For more information about the options in the Select Columns red triangle menu, see “Column Filter Menu” in Using JMP.
Y, n Defective
(Available only for P, NP, and Laney P′ control charts.) Assigns the process variables.
Y, n Defects
(Available only for C, U, and Laney U′ control charts.) Assigns the process variables.
Subgroup
Assigns the subgroup variables. When a subgroup variable is assigned, each point on the control chart corresponds to a summary statistic for all of the points in the subgroup.
Label
Assigns a sample label variable to uniquely label individual measurements. The labels are not sorted and appear on the horizontal axis in the same order they appear in the data table.
Note: If a subgroup size greater than one is specified by a Subgroup variable, a constant subgroup size, or the Set Subgroup Size command in a script, the Label variable is ignored.
n Trials
Assigns the subgroup sample size.
Phase
Assigns the phase variable. When a Phase variable is assigned, separate control limits are computed for each phase.
By
Identifies a variable to produce a separate analysis for each value that appears in the column.
Launch Window for Short Run Control Charts
This section contains information about the launch windows for Short Run Control Charts.
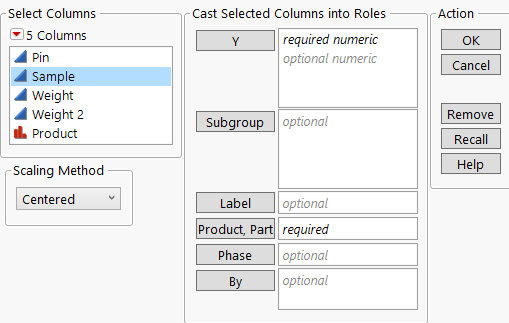
Figure 3.7 Launch Window for Short Run Control Charts
For more information about the options in the Select Columns red triangle menu, see “Column Filter Menu” in Using JMP.
Y
Assigns the process variables.
Subgroup
Assigns the subgroup variables. When a subgroup variable is assigned, each point on the control chart corresponds to a summary statistic for all of the points in the subgroup.
Label
Assigns a sample label variable to uniquely label individual measurements. The labels are not sorted and appear on the horizontal axis in the same order they appear in the data table.
Note: If a subgroup size greater than one is specified by a Subgroup variable, a constant subgroup size, or the Set Subgroup Size command in a script, the Label variable is ignored.
Product/Part
Assigns the Product/Part variable. When a Part variable is assigned, statistics are calculated for each product, or level of the Part variable. These statistics are used to calculate the control limits.
Phase
Assigns the phase variable. When a Phase variable is assigned, separate control limits are computed for each phase.
Note: If there is a spec limits column property, by default, the same specification limits are used for each phase.
By
Identifies a variable to produce a separate analysis for each value that appears in the column.
Scaling Method
Specifies the scaling method for the control chart. The options are Centered and Standardized.
Launch Window for Rare Event Control Charts
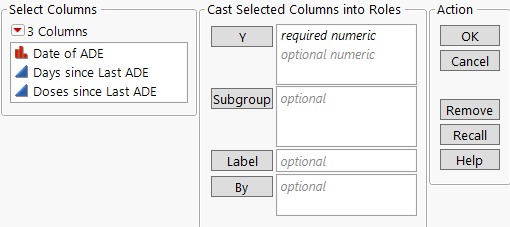
Figure 3.8 Launch Window for Rare Even Control Charts
For more information about the options in the Select Columns red triangle menu, see “Column Filter Menu” in Using JMP.
Y
Assigns the process variables.
Subgroup
Assigns the subgroup variables. When a subgroup variable is assigned, each point on the control chart corresponds to a summary statistic for all of the points in the subgroup.
Label
Assigns a sample label variable to uniquely label individual measurements. The labels are not sorted and appear on the horizontal axis in the same order they appear in the data table.
Note: If a subgroup size greater than one is specified by a Subgroup variable, a constant subgroup size, or the Set Subgroup Size command in a script, the Label variable is ignored.
By
Identifies a variable to produce a separate analysis for each value that appears in the column.


