Legacy Control Charts
Create Variable and Attribute Control Charts
The legacy control chart platforms in JMP provide a variety of control charts, as well as runs charts, V-Mask CUSUM charts, and weighted moving average charts. To support process improvement initiatives, most of the control chart options display separate control charts for different phases of a project on the same chart.
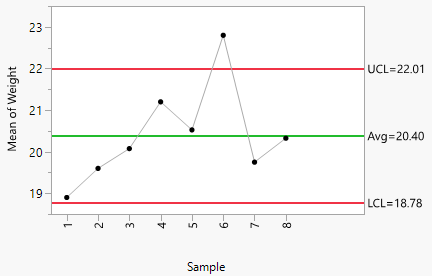
A control chart is a graphical and analytic tool for monitoring process variation. The natural variation in a process can be quantified using a set of control limits. Control limits help distinguish common-cause variation from special-cause variation. Typically, action is taken to identify and eliminate special-cause variation. It is also important to quantify the common-cause variation in a process, as this determines the capability of a process.
Figure 14.1 Control Chart Example
