Residuals Chart
In the EWMA Control Chart platform, the residuals chart shows the differences between the exponentially weighted moving averages and the observed values:
• If you specified a Subgroup variable and at least one subgroup size is greater than 1, the residuals chart is a chart of the differences between each subgroup mean and the EWMA value for the previous subgroup. The ith residual is calculated as ri = Xi - EWMAi-1 where Xi denotes the ith subgroup mean and EWMAi-1 denotes the (i-1)th EWMA value.
• Otherwise, the residuals chart is a chart of the differences between each sample value and the EWMA value for the previous sample. The ith residual is calculated as ri = Xi - EWMAi-1 where Xi denotes the ith sample value and EWMAi-1 denotes the (i-1)th EWMA value.
The limits on the residuals chart are ±3*ResidSigma, where ResidSigma is the standard deviation of the residuals.
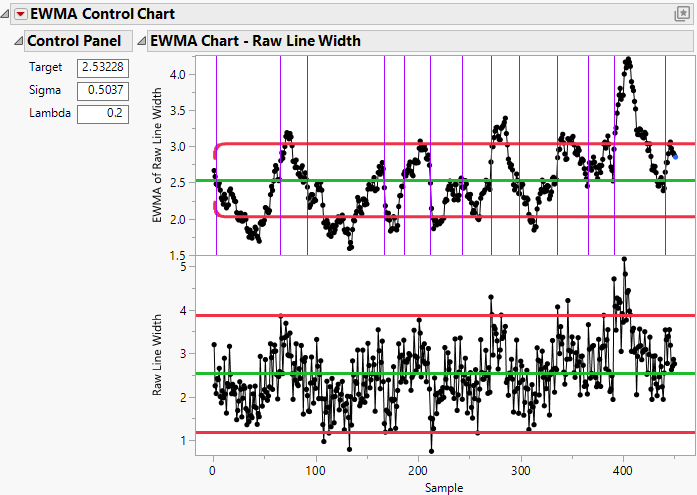
The EWMA and residuals charts can be used to identify possible seasonality and autocorrelation in a process. For example, in Figure 11.6, the peaks and valleys in the EWMA chart are evidence of seasonality in the process. The points outside limits in the residuals chart are evidence of autocorrelation. For this example, it would be appropriate to fit a time series model to the process observations and create a control chart for the residuals from the time series model. For more information about using the residuals chart for detecting autocorrelation, see Montgomery and Mastrangelo (1991).
Figure 11.6 Example of Autocorrelation and Seasonality in a Process
