Spec Limits Window
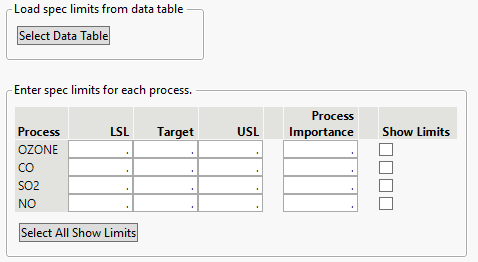
You can enter known specification limits for a process in the Spec Limits window. This window appears if you selected If Needed or Yes for the Show Spec Limits Dialog options in the Process Capability launch window. Figure 9.7 shows the Spec Limits window for the Cities.jmp sample data table after selecting OZONE, CO, SO2, and NO as process variables in the launch window. Enter the known specification limits and click OK to view the Process Capability report.
You can specify process importance values for each column. Process importance values provide a mechanism to sort processes in the order that you prefer. Process importance values are used to size markers in many of the graphs in the Process Capability report.
If you select the Show Limits option for a process and then save the specification limits to a column property, the Show as Graph Reference Lines option is selected in the saved Spec Limits column property. If you select the Show Limits option for a process and then save the specification limits to a new table, the Show Limits column in the new table contains a 1 for the process. The Select All Show Limits button selects the Show Limits option for all processes.
Figure 9.7 Spec Limits Window for Cities.jmp
Limits Data Table
You can also specify limits in a process capability analysis using a limits data table. Click the Select Data Table button and then select the appropriate data table that contains the specification limits for the analysis. After you select the appropriate limits table, the values populate the window. Click OK to view the Process Capability report.
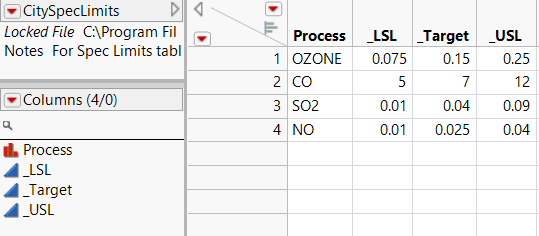
A limits data table can be in two different formats: tall or wide. A tall limits data table has one column for the responses and the limits key words are the other columns. A wide limits data table has a column for each response with one column to label the limits keys. Either of these formats can be read using the Load spec limits from data table option.
• A tall table contains four or five columns and has one row for each process. The first column has a character data type and contains the names of the columns analyzed in the Process Capability platform. The next three columns need to be named LSL, Target, and USL. These column names can also be preceded by an underscore character. The optional final column named Show Limits specifies if the specification limits are shown as reference lines in select analysis plots.
Figure 9.8 Example of a Tall Specification Limits Table
• A wide table contains three rows and one column for each column analyzed in the Process Capability platform plus a _LimitsKey column. In the _LimitsKey column, the three rows need to contain the identifiers _LSL, _Target, and _USL.
Figure 9.9 Example of a Wide Specification Limits Table
The easiest way to create a limits data table is to save results computed by the Process Capability platform. The Save options in the Process Capability red triangle menu enable you to save limits from the sample values. After entering or loading the specification limits, you can do the following:
• Select Save > Save Spec Limits as Column Properties to save the limits as Spec Limits column properties to the columns in the data table.
• Select Save > Save Distributions as Column Properties to save the distributions used in calculating capability as Process Capability Distribution column properties to the columns in the data table.
• Select Save > Save Spec Limits to New Table to save the limits to a new tall specification limits data table. If you have selected at least one nonnormal distribution, a column called Distribution that contains the specified distributions is also added to the limits data table.


