Publication date: 02/06/2025
The Parallel Plot
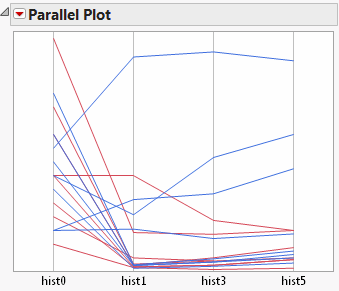
A parallel plot is one of the few types of coordinate plots that show any number of variables in one plot. However, the relationships between variables might be evident only in the following circumstances:
• when the variables are side by side
• if you assign a color to a level of a variable to track groups
• if you select lines to track groups
Note: To produce the plot shown in Figure 7.5, follow the instructions in Example of a Parallel Plot.
Figure 7.5 The Parallel Plot Report
Tip: You can add reference lines for specification limits. For information, see “Spec Limits” in Using JMP.
Want more information? Have questions? Get answers in the JMP User Community (community.jmp.com).
