Control Chart Builder Interactive Workspace
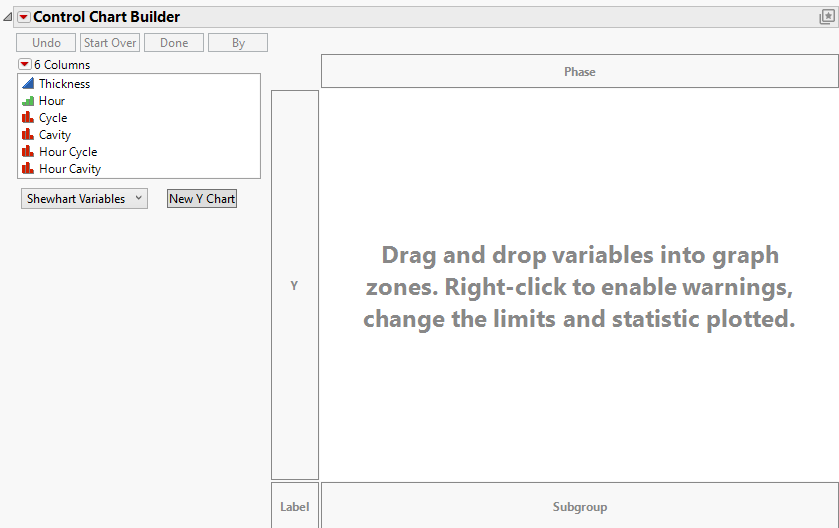
To begin creating a control chart interactively, drag variables from the Select Columns box into the zones. If you drop variables in the center, Control Chart Builder guesses where to put them based on whether the variables are continuous or categorical.
Figure 3.4 Interactive Control Chart Builder Window
For more information about the options in the Select Columns red triangle menu, see Column Filter Menu in Using JMP.
The Control Chart Builder workspace contains the following zones:
Y
Assigns the process variable.
Label
Assigns a sample label variable to uniquely label individual measurements. The labels are not sorted and appear on the horizontal axis in the same order they appear in the data table.
Subgroup
Assigns subgroup variables. To define subgroup levels as a combination of multiple columns, add multiple variables to the Subgroup zone. When a subgroup variable is assigned, each point on the control chart corresponds to a summary statistic for all of the points in the subgroup.
Phase
(Not available for Rare Event control charts.) Assigns a phase variable. When a Phase variable is assigned, separate control limits are computed for each phase. See also Example of an XBar and R Chart.
Part
(Available only for Short Run control charts.) Assigns the Part variable. When a Part variable is assigned, statistics are calculated for each product, or level of the Part variable. These statistics are used to calculate the control limits.
n Trials
(Available for Attribute charts.) Assigns a lot size for an attribute control chart.
The initial Control Chart Builder window contains the following buttons:
Undo
Reverses the last change made to the window.
Start Over
Returns the window to the default condition, removing all data, and clearing all zones.
Done
Hides the buttons and the Select Columns box and removes all drop zone outlines. In this presentation-friendly format, you can copy the graph to other programs. To restore the window to the interactive mode, click the Control Chart Builder red triangle and select Show Control Panel.
By
Identifies the variable and produces a separate analysis for each value that appears in the column.
Shewhart Variables/Shewhart Attribute/Short Run/Rare Event
Enables you to select Shewhart Variables, Shewhart Attribute, Short Run, or Rare Event control chart types. If you select an Attribute chart type, an n Trials box and zone appear on the chart. If you select a Short Run chart type, a Part zone appears on the chart.
n Trials
(Available for Attribute charts.) Assigns a lot size for an attribute control chart.
New Y Chart
Produces a copy of the current chart for every column selected in the Select Columns box. The new charts use the selected columns in the Y role.
Once you drag variables to the chart, other buttons and options appear at left that enable you to show, hide or switch items on the chart (Figure 3.9). Many of these functions (Points, Limits, Warnings, etc.) are the same as the functions available when you right-click the chart. See Options Panel and Right-Click Chart Options. For information about warnings and rules, see Tests and Westgard Rules.
