Data Format
When using the Time Series Forecast platform, multiple time series can be organized as individual columns in a table or they can be stacked in a single column with one or more grouping columns to identify the individual series. You can also have a combination of multiple Y columns and multiple grouping columns.
The platform makes the following assumptions about the data:
• All of the time series are recorded at the same time resolution.
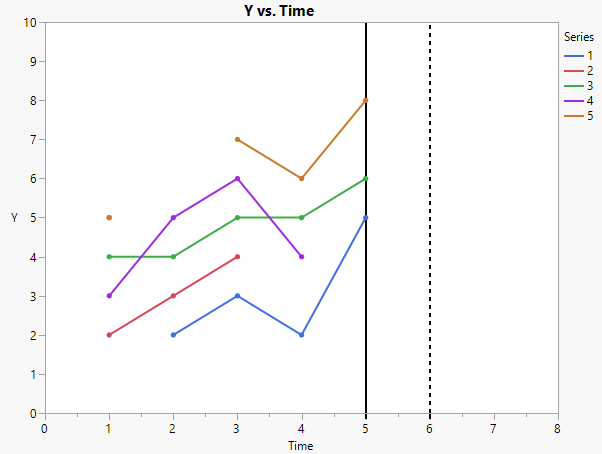
• All of the time series are collected up to the same final observed time point. This final observed time point is defined as the latest time point that occurs in any of the individual time series. A series without data up to the final observed time point is assumed to have missing values. For example, in Figure 19.5, the final observed time point is 5, represented by the solid black line. It is assumed that Series 2 has missing observations at time points 4 and 5 and that Series 4 has a missing observation at time point 5.
• All of the forecasts start at the same time point. This starting time point is the next time point following the final observed time point. For example, in Figure 19.5, the final observed time point is 5, represented by the solid black line. Therefore, all of the forecasts start at time point 6, represented by the dashed black line.
Figure 19.5 Demonstration of Assumptions
