Publication date: 06/27/2024
EWMA Control Charts
Create Exponentially Weighted Control Charts
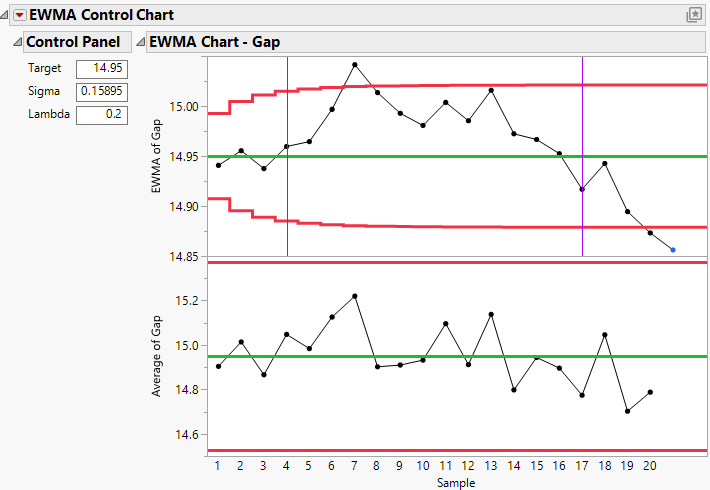
Exponentially weighted moving average (EWMA) charts can be used to detect small shifts in a process. Each point on an EWMA chart is the weighted average of all the previous subgroup means, including the mean of the present subgroup sample. The weights decrease exponentially going backward in time.
Figure 11.1 EWMA Control Chart Report
Contents
Overview of the EWMA Control Chart Platform
Example of the EWMA Control Chart Platform
Launch the EWMA Control Chart Platform
The EWMA Control Chart Platform Report
Control Panel for EWMA Control Chart
EWMA Chart Report
The EWMA Control Chart Platform Options
Average Run Length (ARL) Report
Residuals Chart
Additional Example of the EWMA Control Chart Platform
Statistical Details for the EWMA Control Chart Platform
Want more information? Have questions? Get answers in the JMP User Community (community.jmp.com).
