Example of a Definitive Screening Design with Blocking
This example uses a definitive screening design with a blocking variable. Suppose that, due to raw material constraints, an extraction experiment requires that you run it using material from two separate lots. A blocking variable can account for the potential lot variation.
Create the Design
The extraction factors and their settings are given in the data table Extraction Factors.jmp. Generate a definitive screening design with a block:
1. Select DOE > Definitive Screening > Definitive Screening Design.
2. Double-click Y under Response Name and type Yield.
3. Select Help > Sample Data Folder and open Design Experiment/Extraction Factors.jmp.
4. Click the red triangle next to Definitive Screening Design and select Load Factors.
The factor names and ranges are added to the Factors section.
5. Click Continue.
The Design Options section opens. Here you can specify a blocking structure.
6. Select Add Blocks with Center Runs to Estimate Quadratic Effects.
Leave Number of Blocks set at 2.
You are re-creating the design for the Extraction2 Data.jmp sample data table, which was created without Extra Runs. Although four Extra Runs are strongly recommended, you do not add Extra Runs in this example.
7. Next to Number of Extra Runs, select 0.
8. Click Make Design.
The Definitive Screening Design window updates to show a Design section and a Design Evaluation section.
Check that Block has been added to the Factors section and to the Design.
9. In the Factors section, Double-click Block and type Lot.
In the Output Options panel, note that the Run Order is set to Randomize within Blocks.
10. Click Make Table.
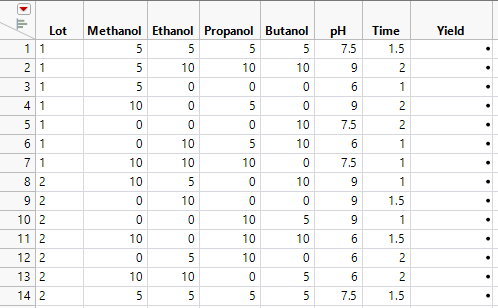
Note: The runs in your design might appear in a different order than the order shown in Figure 8.13.
Figure 8.13 Definitive Screening Design with Block for Extraction Process
Notice that run 1 is a center point run in Lot 1 and run 14 is a center point run in Lot 2.
Analyze the Experimental Data
At this point, you conduct your experiment and record your data in the Yield column of the design table (Figure 8.13). The Extraction2 Data.jmp sample data table contains your experimental results. The runs in the Extraction2 Data.jmp sample data table are in a different order than those in Figure 8.13.
To explore all second-order effects, one option is to use All Possible Models regression. Another option is to use forward stepwise regression. However, these standard methods often fail to identify active effects. For this reason, you use the Fit Definitive Screening platform.
1. Select Help > Sample Data Folder and open Design Experiment/Extraction2 Data.jmp.
2. In the Table panel of the design table, click the green triangle next to the Fit Definitive Screening script.
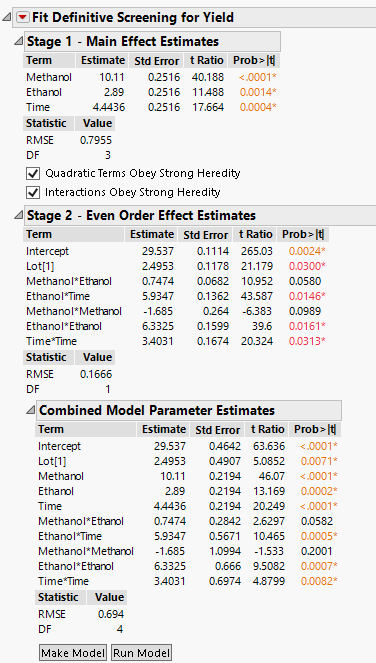
Figure 8.14 Fit Definitive Screening Report
The effects identified by Fit Definitive Screening as potentially active are listed in the Combined Model Parameter Estimates report.
3. Click the Run Model button at the bottom of the Combined Model Parameter Estimates report.
This fits a standard least squares model to the effects identified as potentially active.
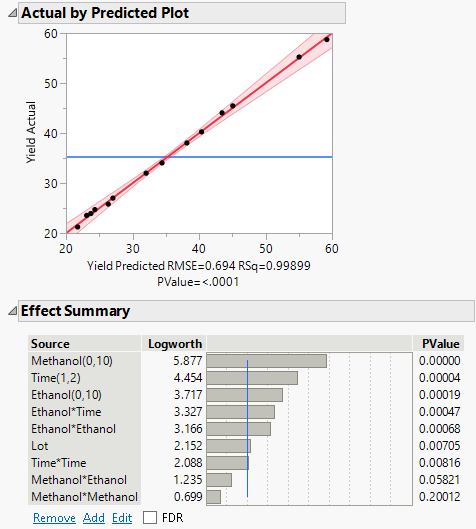
Figure 8.15 Standard Least Squares Report
The Actual by Predicted Plot shows no evidence of lack of fit. The Effect Summary report shows that Methanol*Ethonal and Methanol*Methanol are not significant. You decide to remove these effects from the model.
4. Select Methanol*Ethonal and Methanol*Methanol in the Effect Summary report and click Remove.
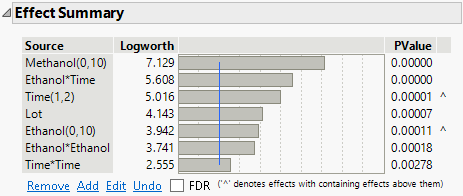
Figure 8.16 Final Set of Active Effects
The remaining effects are all significant. You conclude that these are the active effects.


